ISSS608 2018-19 T1 Assign Choo Mei Xuan task3
|
|
|
|
|
|
Task 3
Urban air pollution is a complex issue. There are many factors affecting the air quality of a city. Some of the possible causes are:
Local energy sources. For example, according to Unmask My City, a global initiative by doctors, nurses, public health practitioners, and allied health professionals dedicated to improving air quality and reducing emissions in our cities, Bulgaria’s main sources of PM10, and fine particle pollution PM2.5 (particles 2.5 microns or smaller) are household burning of fossil fuels or biomass, and transport.
Local meteorology such as temperature, pressure, rainfall, humidity, wind etc
Local topography
Complex interactions between local topography and meteorological characteristics.
Transboundary pollution for example the haze that intruded into Singapore from our neighbours.
In this third task, you are required to reveal the relationships between the factors mentioned above and the air quality measure detected in Task 1 and Task 2. Limit your response to no more than 5 images and 600 words.
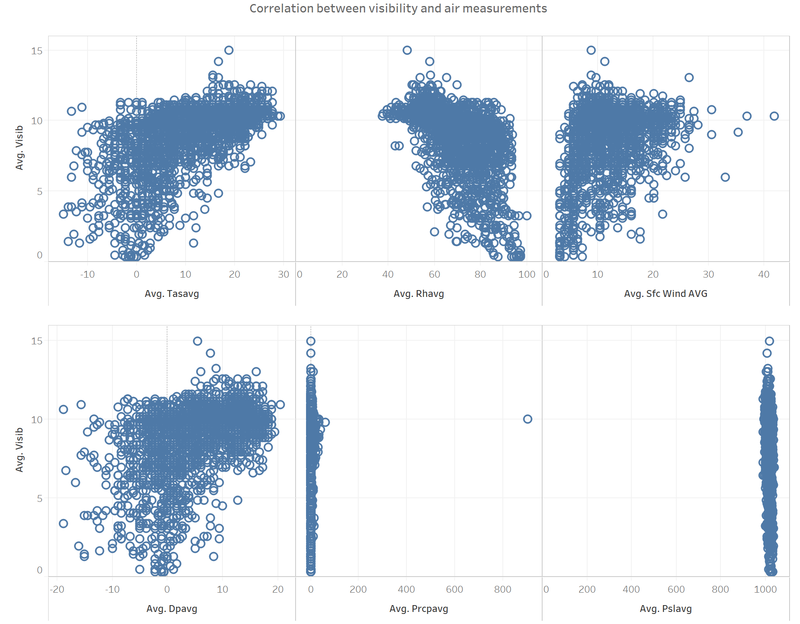
Figure 1. Correlation between visibility and air measurements
Using the meteorology data to investigate the relationships between average visibility and average temperature (Avg Tasavg), relative humidity (Avg Rhavg), daily average wind speed (Avg Sfc Wind Avg), daily average dew point temperature (Avg Dpavg), daily average precipitation amount (Avg Precpavg) and daily average surface pressure (Avg Pslavg).
Visibility is defined as the greatest distance at which a black object of suitable dimensions, situated near the ground, can be seen and recognised when observed against a bright background. [1]
As visibility is measured in Kilometres (km), outliers measurements of -9999 are removed.
It was found that lower visibility due to pollution has a direct correlation with increased rates of mortality in cities such as Hong Kong. [2] Zero visibility has been defined when visibility drops to less than 100metres (0.1km) and high visibility under extremely clean air in the Arctic can be up to 160km. [3]
Observations:
- Positive correlation between average temperature and visibility. As temperature increases, visibility improves
- Similar positive correlation between average dew point temperature and visibility.
- Negative correlation between average humidity and visibility. As humidity increases, visibility falls.
- Slight positive correlation between average wind speed and visibility. As wind speed increases, visibility improves.
- No correlation between average visibility and surface pressure and precipitation amount
With a positive correlation between average temperature and visibility, this shows that winter experienced lower visibility due to a confluence of natural phenomena such as temperature inversion effect. Also, household heating and emissions from vehicles are higher during the winter. [4] This is especially so in lower income Bulgaria where they highly dependent on wood and coal for heating during winter. [5]
With a negative correlation between average humidity and visibility, this shows that there is an increase in chemical reaction between air pollutants and water droplets in the air resulting in the formation smogs and is further exacerbated by the low wind speed. This is supported by the slight positive correlation between average wind spend and visibility. [6]
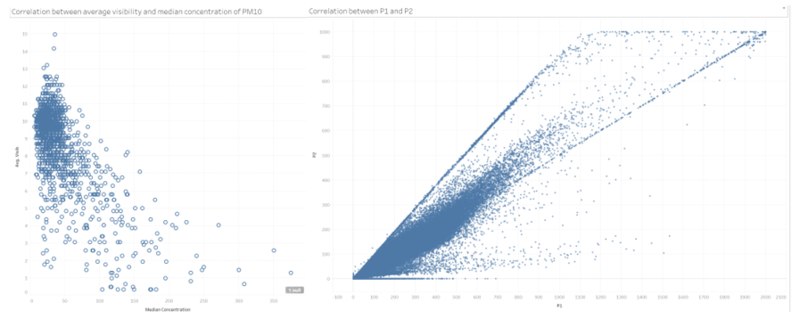
Figure 2. Correlation between visibility and air pollutants
As shown by the scatter plot on the left, there is a slight negative correlation between average visibility and median concentration of PM10 and as shown by the scatter plot on the right there is a positive correlation between P1 (PM10) and P2 (PM2.5). This means that as concentration of PM10 increases together with an increase of PM2.5, average visibility drops. Hence, the abovementioned relationship between concentration of air pollutants and air measurements such as temperature and humidity hold in a similar fashion.
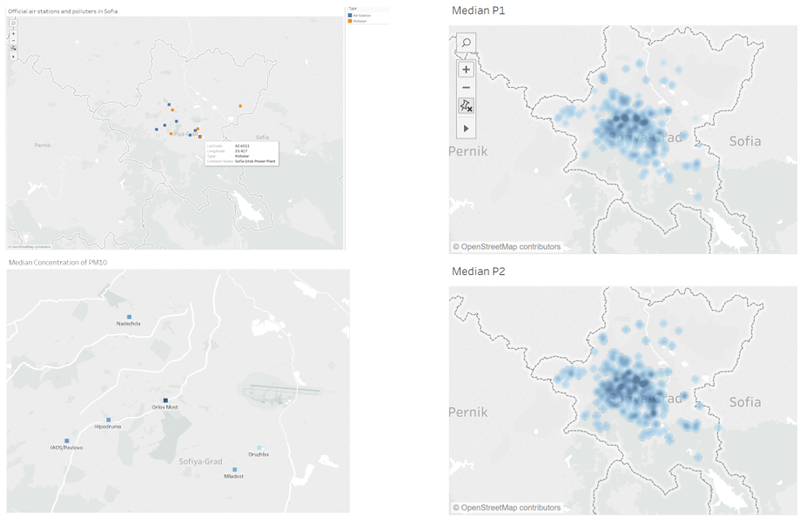
Figure 3. Relationships between polluters and median concentration of air pollutants (Official air stations and Citizen science air sensors)
Polluters in Sofia:
| Polluters |
|---|
| Denya Cement |
| Zlatna Panega Cement |
| Holcim |
| Sofia Power plant |
| Sofia Iztok Power Plant |
| Sofia Integrated Municipal Waste |
Table 1. Polluters in Sofia City
It is obvious that the data collected by the Citizen Science air sensors and the official air stations show that the median concentration of P1/ PM10 and P2 are slightly higher in the centre of Sofia city. This can be used to show the relationship between the location of the 6 polluters located within Sofia city. [7] [8] [9]
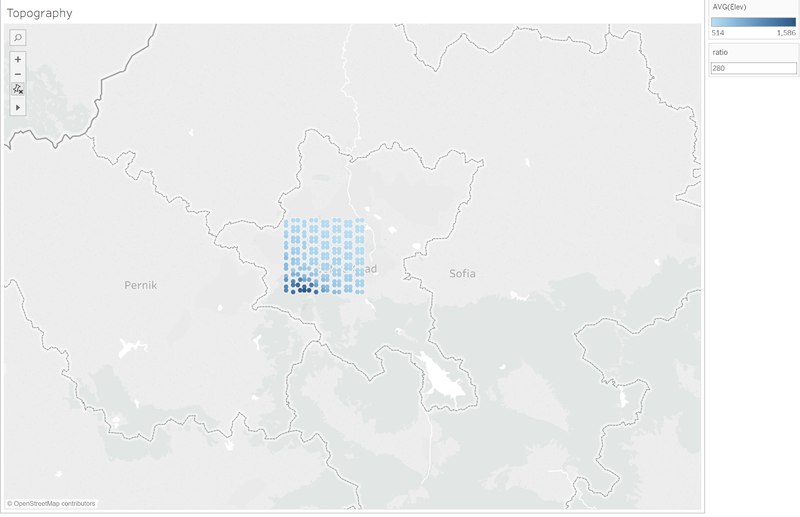
Figure 4. Hexbins to represent elevation of Sofia City
Using figure 3 and 4, it is observed that air quality is slightly worse at areas of Sofia where the elevation is lower.
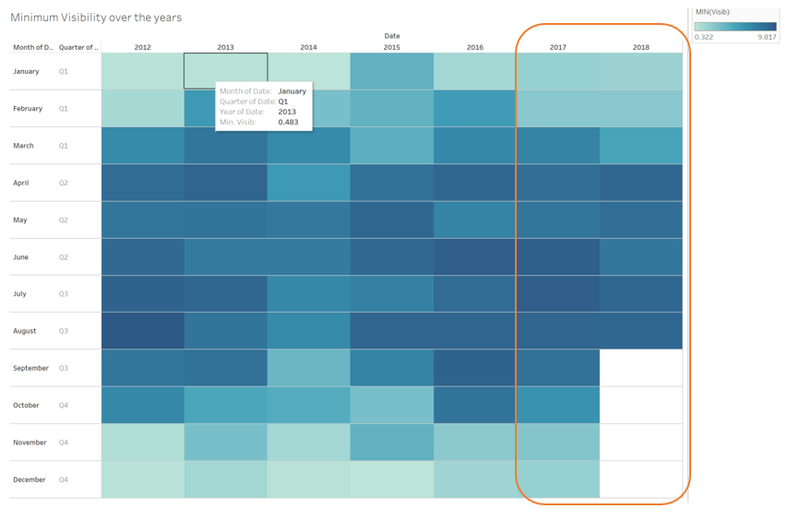
Figure 5. Calendar heatmap of minimum visibility level over the years
It is observed that minimum visibility has improved over the years. This could be due to national level policies which has helped to reduce the level of air pollutants in Bulgaria. It was reported that electric car owners are exempted from paying local tax and parking is free in Sofia and other Cities. Furthermore, the Association of Automobile Manufacturers in Bulgaria has called on the state to introduce a subsidy of 5000 Euro for the purchase of an electric car and 2500 euros for a plug-in hybrid models. [10] Additionally, Bulgaria has its first main road with full charging coverage for electric vehicles since June 2017. [11]
