ISSS608 2018-19 T1 Assign Chen Jingyi Task 3
|
|
|
|
|
|
Discover relationships
PM10 & pm2.4
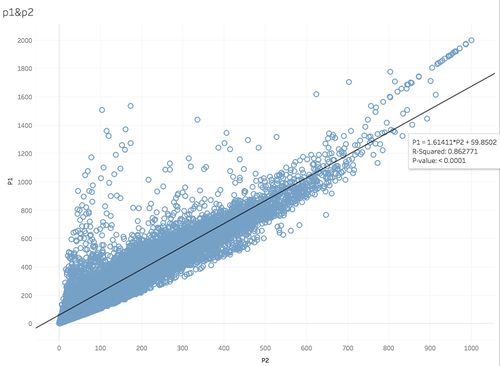
From taks2 we already know that PM 10 and PM 2.5 follows the same trend over time, here we furthur explore the linear trend of these 2 variables, and the result is shown below. The p-value and R squared value indicates that the model is able to explain the majority of observations, which means these 2 measurements are highly related with each other. In later analysis, we will only use PM10 value to examine its relationship with other variables since we can consider same result can be got if use PM2.5 instead.
Local energy sources. For example, according to Unmask My City, a global initiative by doctors, nurses, public health practitioners, and allied health professionals dedicated to improving air quality and reducing emissions in our cities, Bulgaria’s main sources of PM10, and fine particle pollution PM2.5 (particles 2.5 microns or smaller) are household burning of fossil fuels or biomass, and transport. Local meteorology such as temperature, pressure, rainfall, humidity, wind etc Local topography Complex interactions between local topography and meteorological characteristics. Transboundary pollution for example the haze that intruded into Singapore from our neighbours. In this third task, you are required to reveal the relationships between the factors mentioned above and the air quality measure detected in Task 1 and Task 2. Limit your response to no more than 5 images and 600 words.

