ISSS608 2018-19 T1 Assign Chen Jingyi Task 2
|
|
|
|
|
|
Sensors' coverages
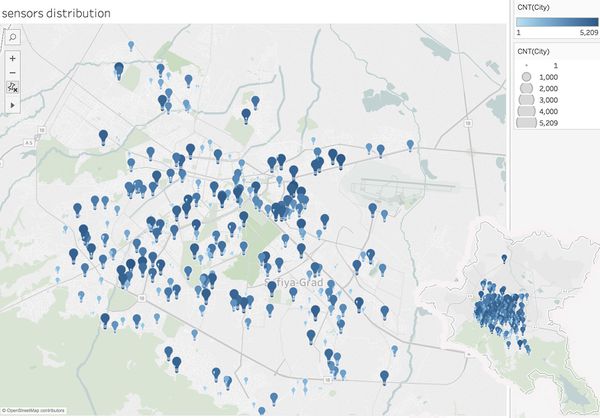
The distribution of sensors over the city is quite interesting, most are evenly distributed in the center area of sofia city, however, on top of the map there exists one lonely station who is isolated from the majority. In all the other sensors, although there are huge discrepancies among the number of records taken by each(ranging from 1 to more than 5000), sensors with large amount of records and those with small amount of records are evenly plotted.
Unexpected observations
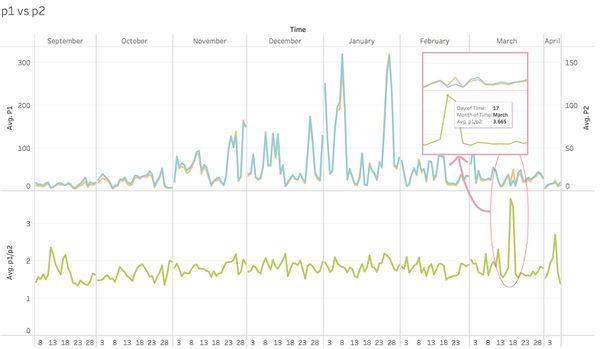
1. Usually, P1 and P2 follow an identical trend, and the ratio of P1/P2 is always around 1.8. However, in Mar 17th and 18th of 2018, the value doubled. This may be a seasonal reason since one unique source of PM10 is pollen.
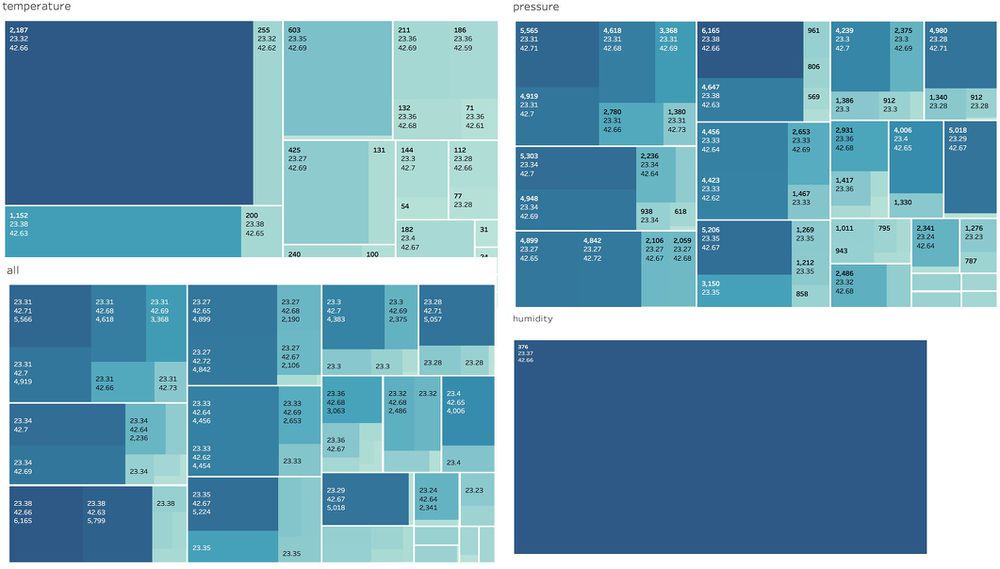
2. There is a high portion of impossible data(more than 10% of total), which should be taken for examination separately. The incorrect records include temperatures which doesn't even exist on earth(-5573°C), humidity below 0 or greater than 100%, pressure equals 0 and so on.
Here we use heat map to show how


