ISSS608 2018-19 T1 Assign Choo Mei Xuan task1
|
|
|
|
|
|
Task 1 Spatio-temporal Analysis of Official Air Quality
Characterize the past and most recent situation with respect to air quality measures in Sofia City. What does a typical day look like for Sofia city? Do you see any trends of possible interest in this investigation? What anomalies do you find in the official air quality dataset? How do these affect your analysis of potential problems to the environment?
Official Air Quality
[1]
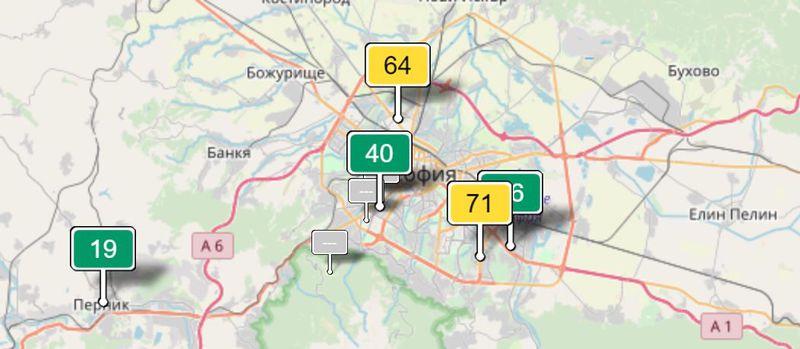
Figure 1. Official Air station in Sofia and its real time measurements of PM10
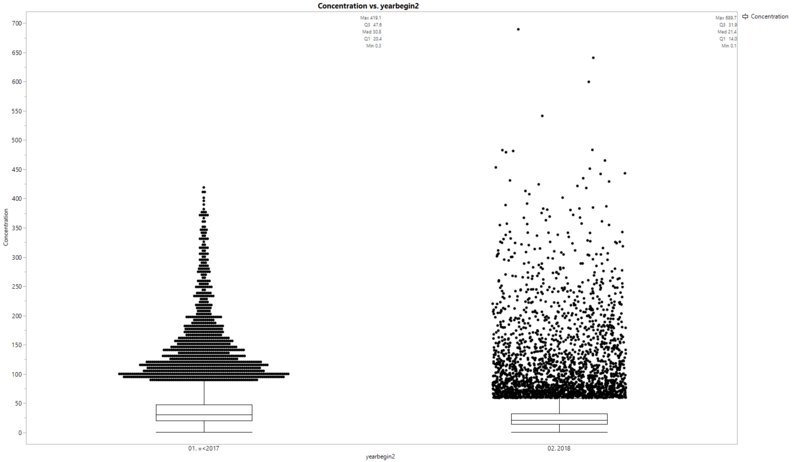
Figure 2. Boxplot of past vs present
As shown in the boxplot above, the average concentration of PM10 in the past at 44.0 µg/m3 is higher than the most recent situation at 29.5 µg/m3. Likewise, the median concentration of PM10 in the past at 30.8 µg/m3 is higher than the most recent situation at 21.4 µg/m3. However, the maximum concentration of PM10 in the past at 419.1 µg/m3 is less than that of the most recent situation at 689.7 µg/m3.
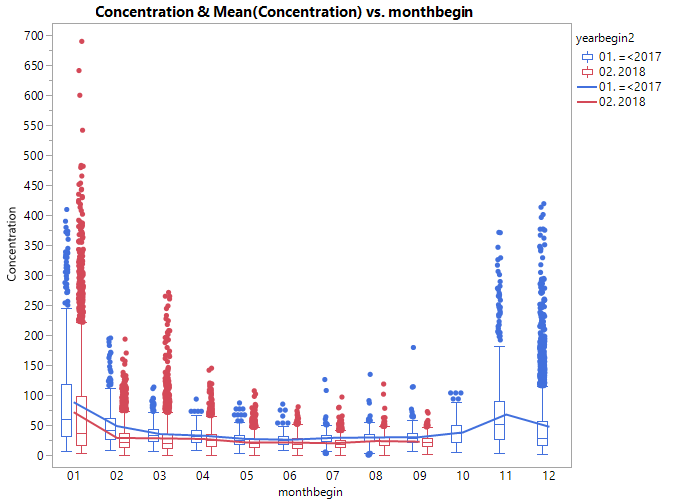
Figure 3. Boxplot of past vs present by months
The average concentration of PM10 across all the months in the most recent year of 2018 is less than that of the past years (2017 and before). And it is observed that the exceedingly high concentration (outlier) of PM10 at 689.7 µg/m3 is during the first month of year 2018.
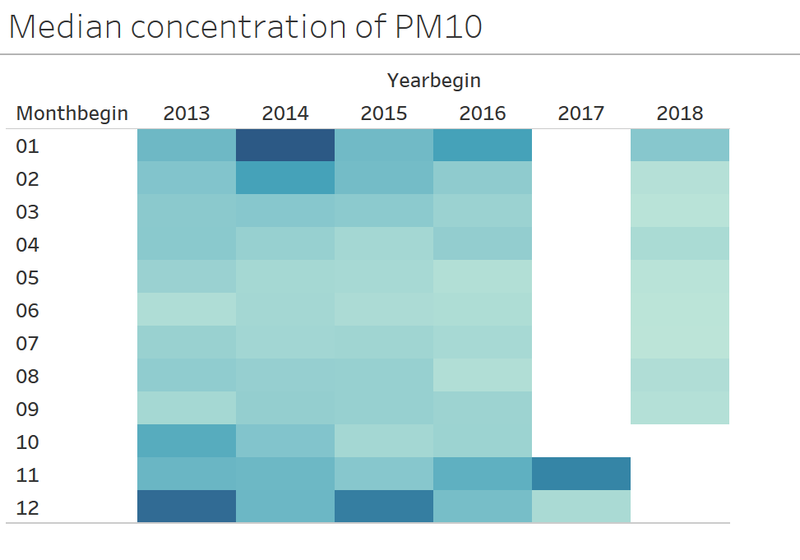
Figure 4. Heatmap of median concentration of PM10 over the years across the months
As shown in the heatmap above, while there is lack of data points for first 10 months of 2017 and last quarter of 2018, it is generally observed that in the first quarter and fourth quarter of the year there is an increase in the median concentration of PM10.
This may be due to the seasonality of the weather where the cold air traps pollutants due to temperature inversion which could increase the median concentration of PM10. Temperature inversion happens when layers of cold air is trapped by layers of warm air above it. Furthermore, as Sofia city is a valley, it is more liable to experience temperature inversion than other cities. This is because the denser and heavier cold air slides down the mountain slope and ends up in a valley, leaving the warmer air above. [2]
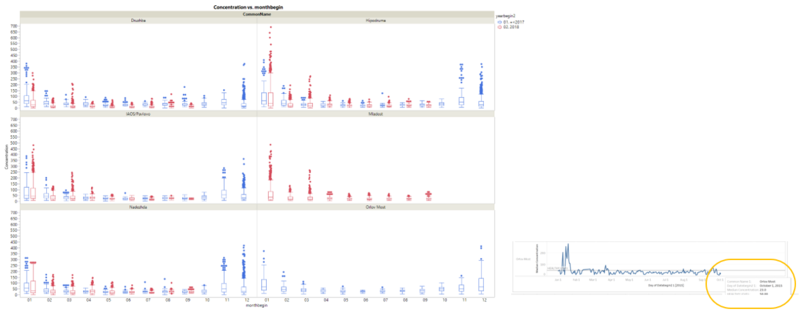
Figure 5. Boxplot of past vs present across air station and months
As noted earlier that there is an exceedingly high concentration of PM10 at 689.7 µg/m3 during the first month of year 2018, this was in the area surrounding air station Hipodruma. While this outlier may seem to be an error in the measurement of the air station, this was not observed in the other months.
Also, air station Orlov Most has ceased to collect data from 1 Oct 2015 onwards. Likewise, Mladost only started to collect data from Jan 2018 onwards.
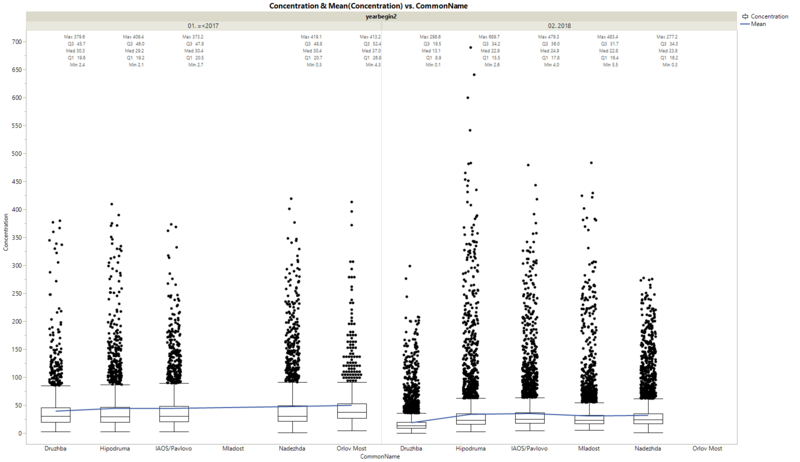
Figure 6. Boxplot of past vs present across air stations
As shown in the boxplot above, in the past (year 2017 and before), the area surrounding Orlov Most air station experienced slightly worse air quality than the rest of the areas. The median value is at 37.0 µg/m3 as compared to the rest of the areas at an average of 30.1 µg/m3. While in the recent year 2018, the area surrounding air station Druzhba are experiencing slightly better air quality than the rest of the areas. The median value is at 13.1 µg/m3 as compared to the rest of the areas at an average of 23.6 µg/m3.
However, as air station Miadost and Orlov Most is not functioning for the full period past years and the most recent year respectively, this may cause inaccurate analysis of the data.

