ISSS608 2018-19 T1 Assign Choo Mei Xuan task1
|
|
|
|
|
|
Task 1 Spatio-temporal Analysis of Official Air Quality
Characterize the past and most recent situation with respect to air quality measures in Sofia City. What does a typical day look like for Sofia city? Do you see any trends of possible interest in this investigation? What anomalies do you find in the official air quality dataset? How do these affect your analysis of potential problems to the environment?
Official Air Quality
[1]
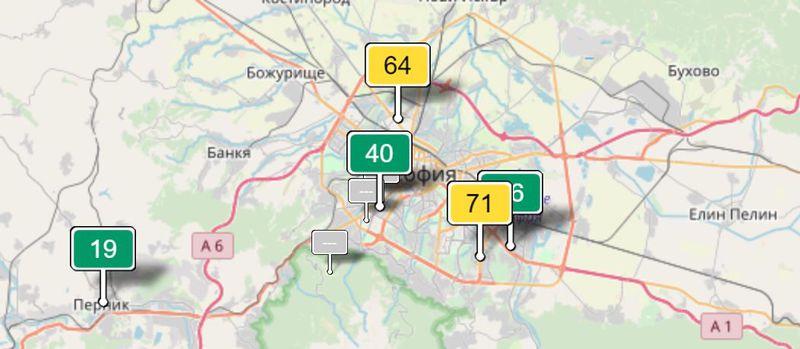
Figure 1. Official Air station in Sofia and its real time measurements of PM10
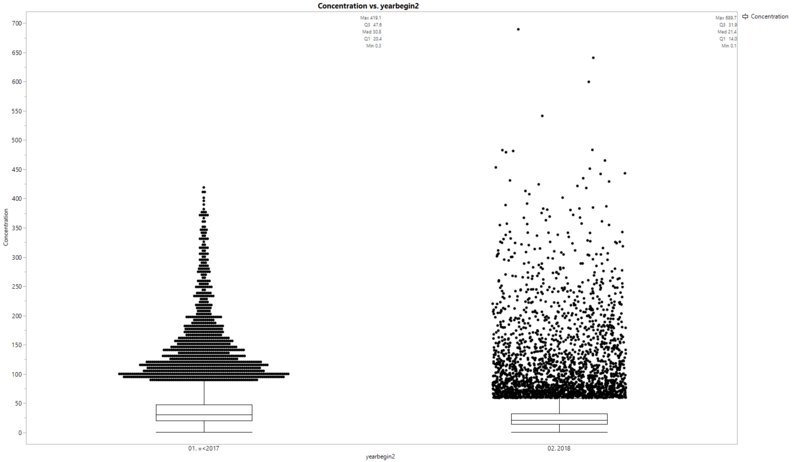
Figure 2. Boxplot of past vs present
As shown in the boxplot above, the average concentration of PM10 in the past at 44.0 µg/m3 is higher than the most recent situation at 29.5 µg/m3. Likewise, the median concentration of PM10 in the past at 30.8 µg/m3 is higher than the most recent situation at 21.4 µg/m3. However, the maximum concentration of PM10 in the past at 419.1 µg/m3 is less than that of the most recent situation at 689.7 µg/m3.
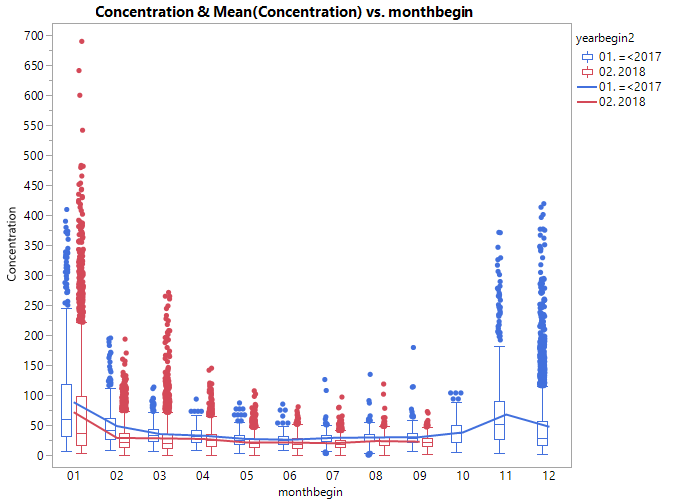
Figure 3. Boxplot of past vs present by months
The average concentration of PM10 across all the months in the most recent year of 2018 is less than that of the past years (2017 and before). And it is observed that the exceedingly high concentration (outlier) of PM10 at 689.7 µg/m3 is during the first month of year 2018.


