ISSS608 2018-19 T1 Assign Kateryna Mazurenko Methodology
|
|
|
|
|
|
Data Preparation
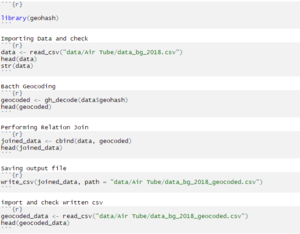
Air Tube (air quality and meteo data measured by citizen) 1. Reverse geocode using geohash package in R - for both files (2017 and 2018 data) and saving it as csv back.
2. Data comes as two files for 2017 and 2018 year, so at first, is was concatenated using JMP software (applying function directly as data has the same structure). 3. Concatenated file: missing pattern run to check for empty rows, 4 rows were excluded and data with no missing fields was saved.
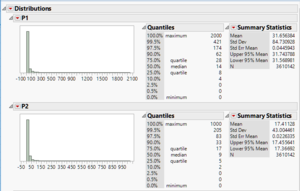
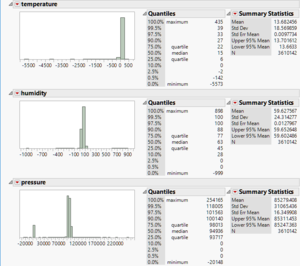
4. Run distribution to check for trustworthy values.
5. Distribution shows a lot of negative values for temperature, pressure and humidity as well as unreasonable(impossible) maximal values. I checked for possible weather conditions in Bulgaria and applied formulas to replace these values with empty space.
I didn’t recode big values in P1/P2 measures as there is no confidence if it’s valid or not. I also regard there two measures separately in future analysis.
6. Format date and time using lubridate in R
EEA Data (official air quality measures) 1. Perform concatenation using JMP - combining all data into one file 2. Check missing pattern, check distribution how many data comes as measured hourly/daily/various
3. As it was not in uniform format, I grouped it as daily average in R. I will use average daily concentration in future analysis.
Meteo-data
1. Run missing patterns and run distributions in JMP - all the data looks trustworthy except for missing values coded as -9999 (as was said in metadata file)
2. Used formulas in JMP to replace unreasonable values with empty space - example shown.
3. Change date format using lubridate in R so it will be possible to join with other files
Topo data was taken as is
Dashboard Design
Methodology heyhey


