ISSS608 2018-19 T1 Assign HyderAli Task 1 Insights
|
|
|
|
|
Two datasets were utilized for the study of official air quality in Sofia, the capital of Bulgaria. The first dataset is historical daily/hourly PM10 data (2013-2018) of Sofia obtained from the 6 Official Air Quality Stations. Observation values include PM10 cocentration, with parameter concentration units in micrograms per cubic metre (μg/m3). The second dataset was retrieved from the 6 air quality monitoring stations in Sofia, all with geographic coordinates. The observation data include time, temperature, humidity, wind speed, pressure, rainfall and humidity. We then proceed to consolidate the air quality data from the following sets:
- Official Air Quality Measurements - 6 Air Quality Stations
- Meteorological Measurements: Temperature, Humidity, Wind Speed, Pressure, Rainfall and Visibility from 6 Air Quality Stations
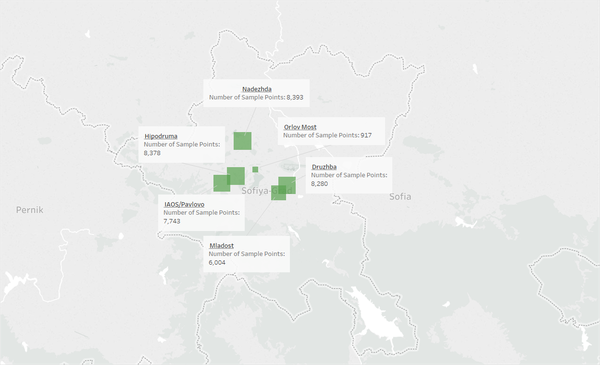
The consolidated data consists of 39,715 measurements from the 6 stations: BG0040A - 8393, BG0050A - 8378, BG0052A - 8280, BG0073A - 7743, BG0079A - 6004 and BG0054A - 917.
Characterize the past and most recent situation with respect to air quality measures in Sofia City. What does a typical day look like for Sofia city? Do you see any trends of possible interest in this investigation? What anomalies do you find in the official air quality dataset? How do these affect your analysis of potential problems to the environment? Your submission for this questions should contain no more than 10 images and 1000 words.
Contents
From 2013 to 2018: The Sofia City
The Sofia map below shows the locations of the 6 Official Air Quality Stations which perform the recording of PM10 concentration levels. Based on the spatial locations, it is evident that all official PM10 recordings were near the center of the Sofia City. Measurement records show that the 39,715 measurements were quite evenly distributed among Nadezhda (21.2%), Hipodruma (21.1%), Orlov Most (2.31%), IAS/Pavlovo (19.5%), Druzhba (20.1%) and Mladost (15.1%).
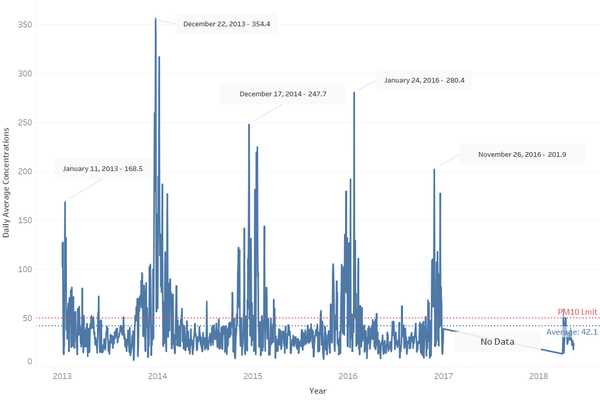
Daily time-series line plot between 2013 and 2018 contains mean daily concentration measurements across the 6 air quality monitoring stations, with no data between Jan-17 and Oct-17. The concentration levels were highly fluctuating with an overall concentration of 42.1 μg/m3, below the limit value of 50 μg/m3. The highest peak was recorded on 22-Dec-2013 with a mean concentration of 354.4 μg/m3 along with other significant peaks during the Nov-Dec periods of the year. Through, the basic visualization, we observe an overall decreasing trend in the daily PM10 concentration levels over the 5 years between 2013 and 2018. Could the decreasing trend be representative of efforts by the Sofia city in meeting their long-term objectives of attaining a cleaner air?
A Typical Day in Sofia - 14 Sep 2018...
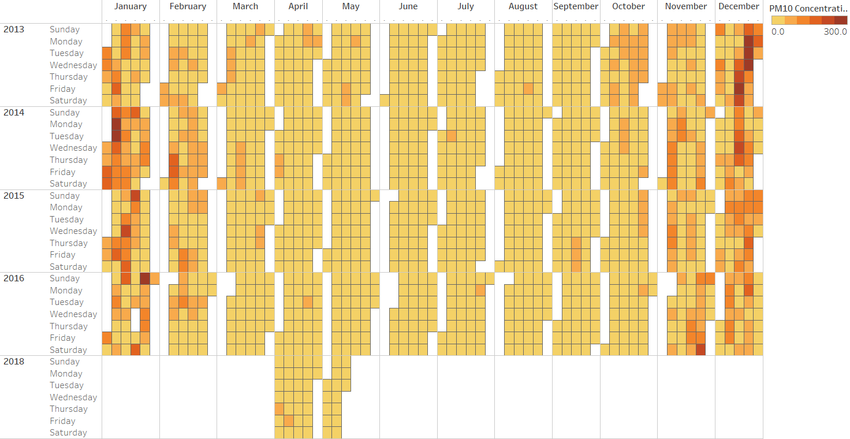
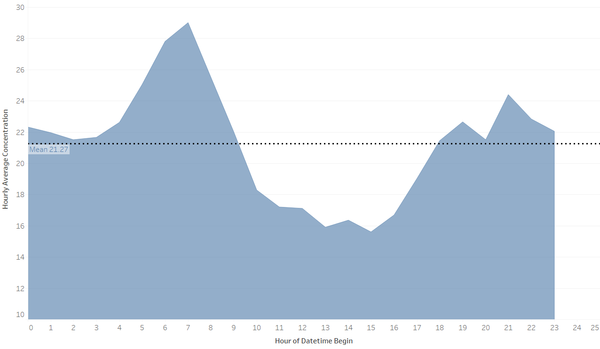
As shown in the calendar view, days with mean PM10 concentration levels greater than 200 (heavily-polluted) largely occurs during November to January period. We then proceed to sample hourly mean PM10 concentration measurements across the 6 stations on one of the least polluted days - 14 Sep 2018. The hourly mean PM10 concentrations averages to approximately to 21.27 μg/m3, below the limit value of 50 μg/m3. The highest peak was recorded around 7am with a concentration of approximately 29.00 μg/m3 and the lowest trough around 3pm of approximately 15.80 μg/m3; the trend rises above the average line in the morning between 4am to 9am and then starts falling below the average line during the later portion of the day between 10am to 5pm.
Is Sofia's Air Quality time invariant?
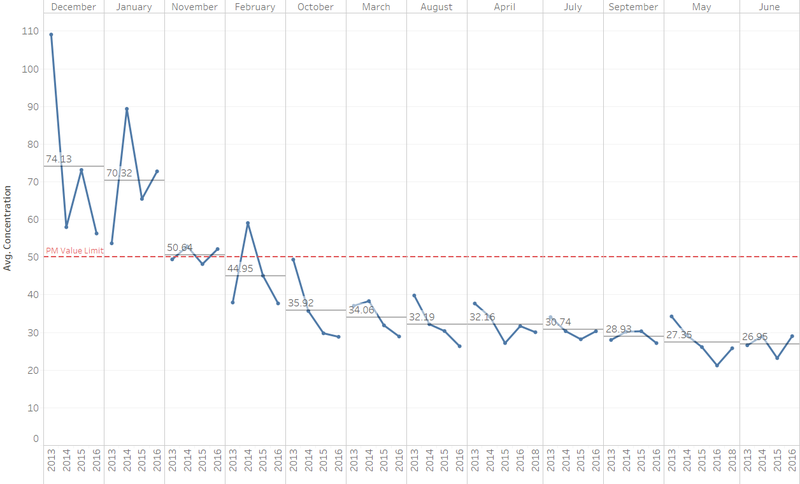
Based on the calendar view above, days with a mean PM10 concentration greater than 200 typically occurs in November to January periods. The cyclical temporal plot below further confirms that the concentration levels were more serious during the autumn/winter periods in December, January and November periods; 74.13, 70.32 and 50.64 μg/m3 respectively. A possible cause of such high pollution levels during this period could be due to a temperature inversion effect: low temperatures and stagnant air during cold seasons have a way of creating a build-up of particulate matter near the ground whereby cold air is trapped near the ground by a layer of warm air which then acts like a lid to hold these substances down.
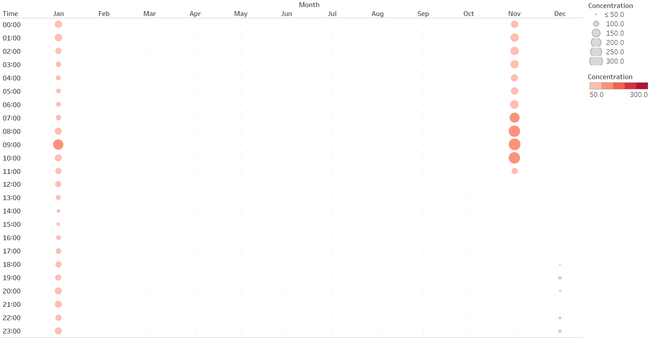
In the heatmap matrix below, column shows the monthly variation whilst the row shows the hourly variation in 24-hour periods averaged across all years. In coherent to the cyclical plot, PM10 concentration levels of more than 150 were concentrated from 8:00 to 10:00 hrs especially during the cold seasons. Thus, the people of Sofia city are advised to stay indoors during these time periods.
Is Sofia's Air Quality location Invariant?
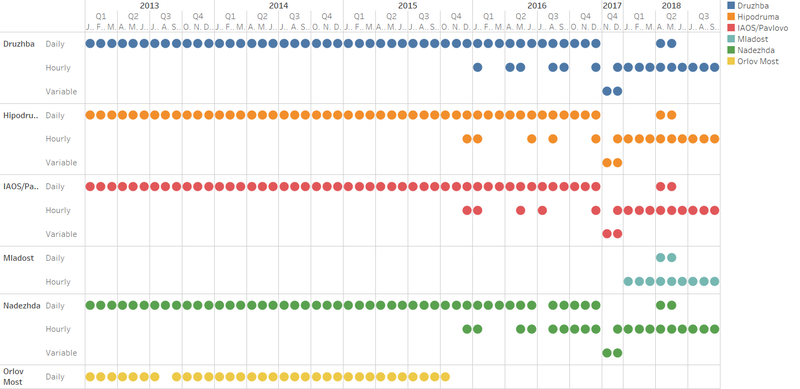
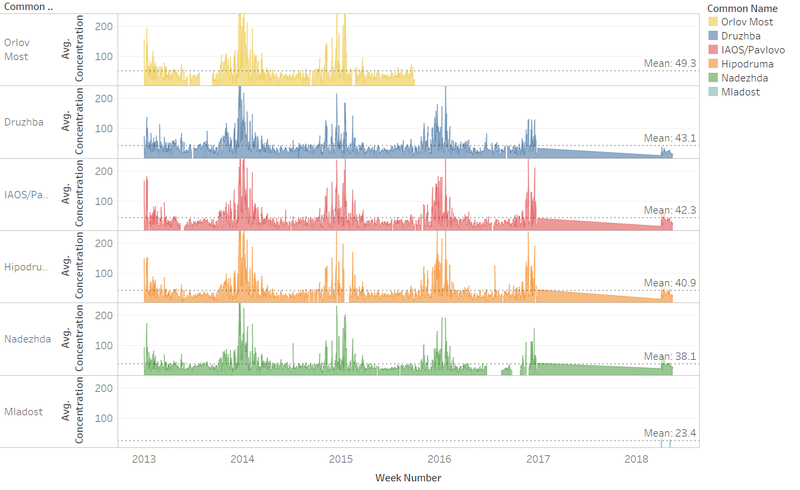
To evaluate the association between the particulate matter levels and the spatial locations of the 6 stations in Sofia city, we need to understand the coverage of daily and hourly readings obtained from the 6 stations. Readings obtained from Druzhba, Hipodruma and Nadhezha stations exhibit similar patterns: mostly daily data with partial hourly between 2017 to 2018. Mladost has only hourly and daily data in the last 2 years whilst Orlov Most has only daily data between 2013 to 2015. Furthermore, the time-series plot across the 6 stations exhibit similar seasonality and trend patterns. The highest recorded average PM10 concentration of 49.3 μg/m3 belonged to Orlov Most whilst the lowest recorded average PM10 concentration of 23.4 μg/m3 belonged to Mladost. The large varied difference arises from the lack of daily readings between 2013 to 2016. As the second lowest average PM10 concentration stands at 38.1 μg/m3, the pollutant level measurements do depend on how rural/urban the sampling site is. As such, the air-quality measure suggests that air quality improves as the areas become more rural (or less urban) due to decreased human activity and lesser peak vehicle traffic.
Is there any day-of-week patterns?
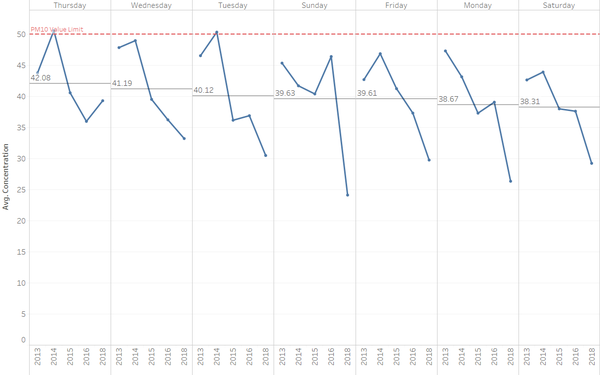
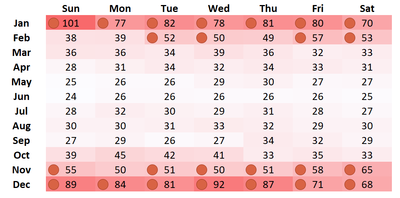
It is quite useful to analyze variations by day of week in the PM10 concentration data. The highest recorded PM10 concentration occurred on Thursday (42.08 μg/m3) whilst the lowest recorded PM10 concentration occurred on Saturday (38.31 μg/m3). Furthermore, the heat table of month and week mean air quality PM10 concentration reveals that the peak levels do occur on both weekdays and weekends. Although some researchers have postulated that higher pollution levels typically occur on weekdays due to higher traffic of heavy-duty vehicles (major source of elemental carbon), this hypothesis may not apply to Sofia city.
