ISSS608 2018-19 T1 Assign Chen Jingyi Task 1
|
|
|
|
|
|
Contents
Basic findings
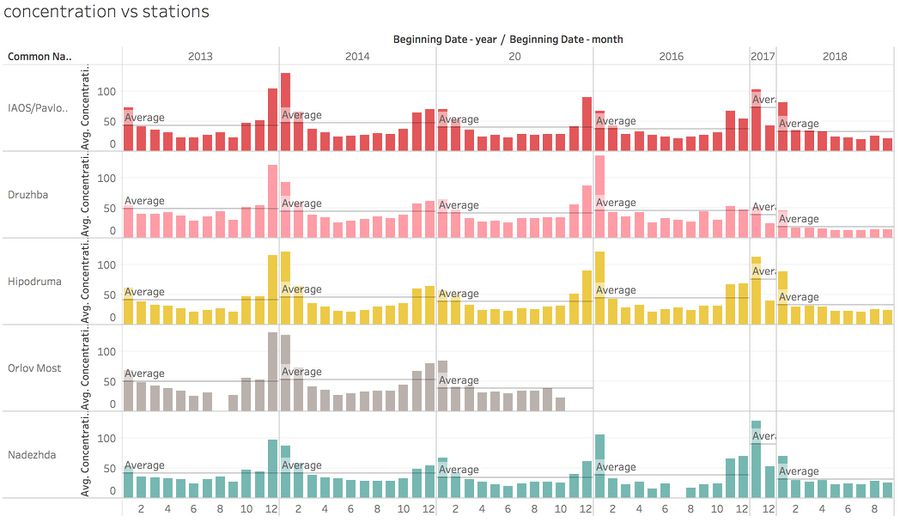
1.Difference in monthly trend of each station in 5 years Overall trend: there's no significant difference among the yearly average pollutant indicator of different stations in 2013-2016, but there is a significant drop in 2018 compared to 2016 data.
overall trend among months almost the same pattern, highest in late autumn and winter (oct to jan), lowest in spring and summer(mar to sep).
extreme peaks in winter- not getting better or even rising.
Anomalies
After deep exploration, we can gather all the unusual trends and observation in this data set:
- Ten months' records are missing in 2017, which makes the data highly biased.
- Station 'Orlov most' stopped collecting data after 2015, and it only records data at midnight, which is very strange.
- 'Hour and var' type: data only consistent from Nov 2017 to Sep 2018, others just random collection from several months, which is weird.In addition, data are collected only from 2015 and onwards(Druzhba only 2016 and onwards),
- 'Day' type: there's no 2017 data, for 2018 there's only records of April and May.
- The different types of 'AveagingTime type' can cause inconsistencies throughout the data.

