ISSS608 2018-19 T1 Assign Chen Jingyi Data preparation
Revision as of 18:46, 16 November 2018 by Jingyi.chen.2017 (talk | contribs)
|
|
|
|
|
|
| Data source | Data preperation | |||||
|---|---|---|---|---|---|---|
| Official air quality measurements (5 stations in the city) (EEA Data.zip) |
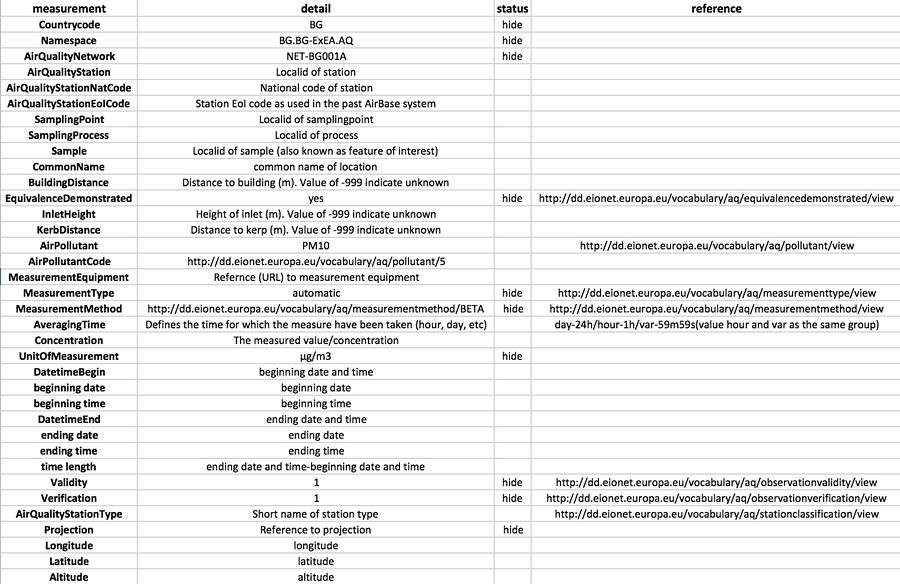
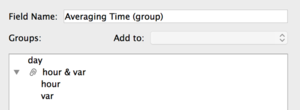
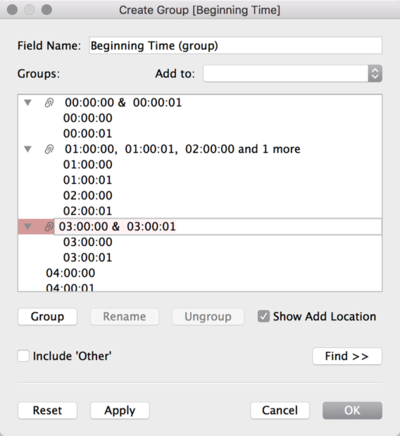
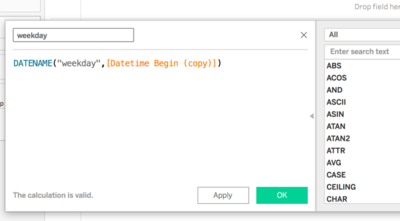
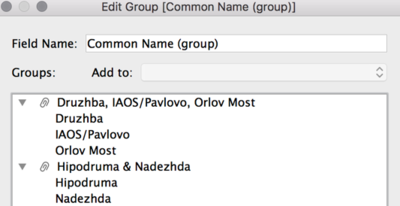
1. Use vlookup to match data from 5 stations with information in metadata.xlsx, the following graph shows how to handle each column. 2. Use tableau to create fields. 2.2 Similarly, group time together. 3 Create new field called “weekday” to generate day information of the week. 4. Group by air quality station type(background=Druzhba +Hipodruma+Nadezhda, traffic=IAOS+Orlov Most) | |||||
| Citizen science air quality measurements (Air Tube.zip) |
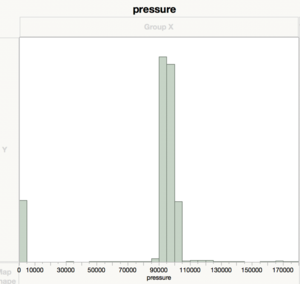
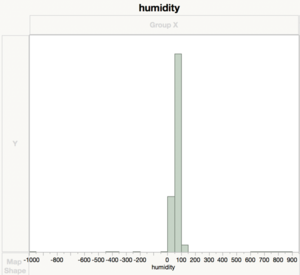
1.Use gh_decode from geohash package in R to turn geohash coordination into longitude and latitude. 2.Use reverse_geocode package in Python to transfer coordinations into a new column with city names. 3.Concatenate 2017 and 2018 data in JMP, and get about 1,700,000 rows of data for exploration and data cleaning. 4.For 'pressure',statistics should be more than 0,but there exists 195390 records=0, which is impossible. 5.For 'humidity',should be within the range of 0 to 100, need to remove ouliers. | |||||
| Meteorological measurements (1 station) (METEO-data.zip) |
1.。。 2... | |||||
| Topography data (TOPO-DATA) |
Nothing special should be done for this data set. 2... |
