ISSS608 2018-19 T1 Assign Chen Jingyi Data preparation
Revision as of 20:17, 15 November 2018 by Jingyi.chen.2017 (talk | contribs)
|
|
|
|
|
|
| Data source | Data preperation | |||||
|---|---|---|---|---|---|---|
| Official air quality measurements (5 stations in the city) (EEA Data.zip) |
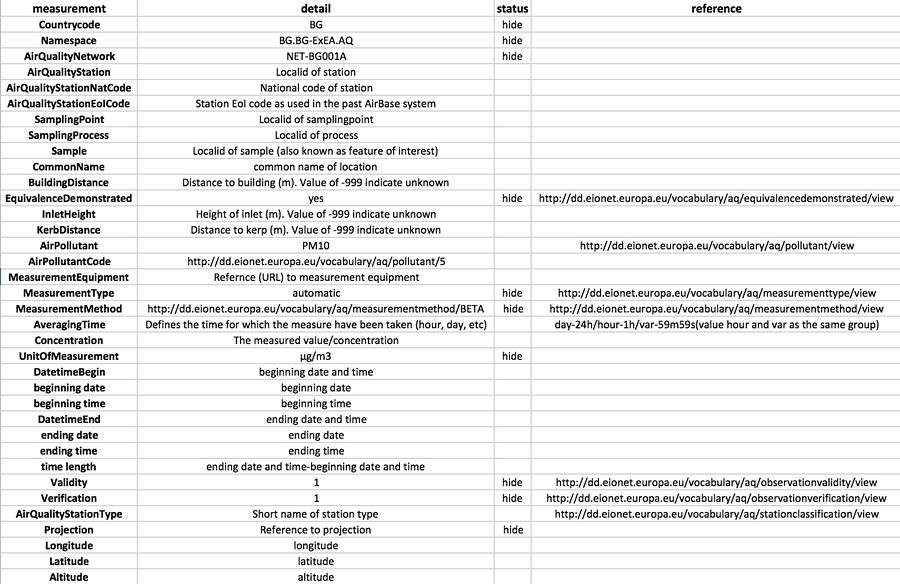
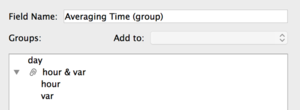
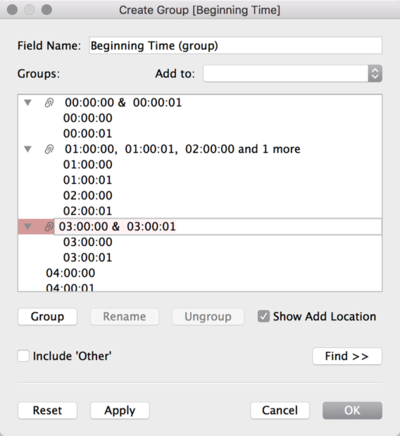
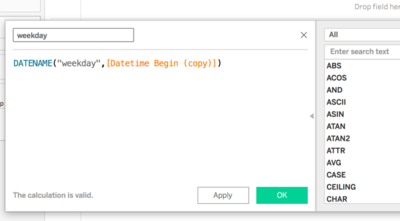
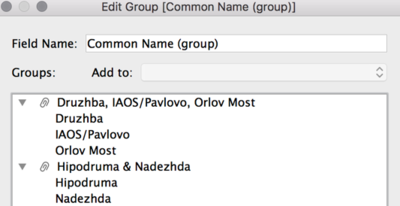
1. Use vlookup to match data from 5 stations with information in metadata.xlsx, the following graph shows how to handle each column. 2. Use tableau to create fields. 2.2 Similarly, group time together. 3 Create new field called “weekday” to generate day information of the week. 4. Group by air quality station type(background=Druzhba +Hipodruma+Nadezhda, traffic=IAOS+Orlov Most) | |||||
| Citizen science air quality measurements (Air Tube.zip) |
1.。。 2... | |||||
| Meteorological measurements (1 station) (METEO-data.zip) |
1.。。 2... | |||||
| Topography data (TOPO-DATA) |
Nothing special should be done for this data set. 2... |
