Difference between revisions of "ISSS608 2018-19 T1 Assign HyderAli Conclusion"
| Line 43: | Line 43: | ||
== Data Visualization Design == | == Data Visualization Design == | ||
<big>'''[https://public.tableau.com/profile/hyder.ali#!/vizhome/Task3-1_0/CorrelationPlot Link 1]'''</big> | <big>'''[https://public.tableau.com/profile/hyder.ali#!/vizhome/Task3-1_0/CorrelationPlot Link 1]'''</big> | ||
| − | <big>'''[https://public.tableau.com/profile/hyder.ali#!/vizhome/ | + | <big>'''[https://public.tableau.com/profile/hyder.ali#!/vizhome/Task3-2_1/Sheet23 Link 2]'''</big> |
Latest revision as of 09:15, 18 November 2018
|
|
|
|
|
In this third task, you are required to reveal the relationships between the factors mentioned below and the air quality measure detected in Task 1 and Task 2. Limit your response to no more than 5 images and 600 words.
- Local energy sources. For example, according to Unmask My City, a global initiative by doctors, nurses, public health practitioners, and allied health professionals dedicated to improving air quality and reducing emissions in our cities, Bulgaria’s main sources of PM10, and fine particle pollution PM2.5 (particles 2.5 microns or smaller) are household burning of fossil fuels or biomass, and transport.
- Local meteorology such as temperature, pressure, rainfall, humidity, wind etc
- Local topography
- Complex interactions between local topography and meteorological characteristics.
- Transboundary pollution for example the haze that intruded into Singapore from our neighbours.
Contents
Relationship between Air Quality Pattern and Local Meteorology
In this section, we will proceed to investigate the relationship between pollutant levels and weather factors such as temperature, pressure, rainfall, humidity and wind speed during high pollutant periods between November and January.
The correlation scatter in the Official and Citizen Science Air Quality shows that P1 (most likely PM 2.5) and P2 (most likely PM 10) are strongly positively correlated with a Pearson's r value = 0.934. The positive correlation between P1 and P2 pollutant concentration levels indicates that P1 and P2 may be emitted by the same sources, or one may be emitted by the transformation of another through some type of chemical mechanism. Thus, a combined physical and chemical analysis of pollutants is desirable to determine the specific reasons. The correlation among pollutant and weather factors such as Pressure, Humidity, Temperature, Wind, Precipitation and Dew Point Temperature is generally low (<0.20), which could be a strong indication that Air Quality is less likely to be linked to natural phenomenon.


Incorporating time-series factor into the pollutant concentration trends, it is evident that the temperature inversion effect (low temperatures and stagnant air during cold seasons have a way of creating a build-up of particulate matter near the ground whereby cold air is trapped near the ground by a layer of warm air which then acts like a lid to hold these substances down) intensifies the air pollution levels in Sofia. As the temperature starts to fall from Nov-17 to Feb-18, P1 and P2 concentration levels starts to rise. Thus, temperature inversions over the city aggravated the air pollution problem in Sofia city.

Relationship between Air Quality Pattern and Local Topography
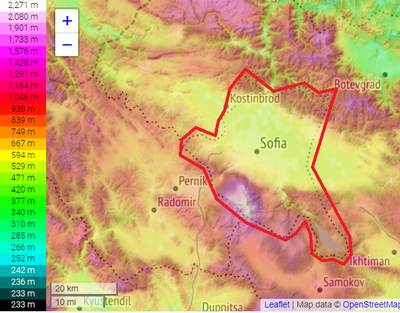
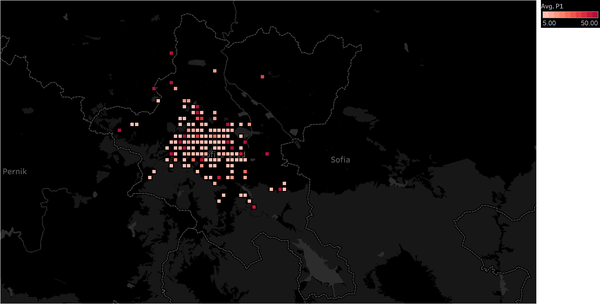
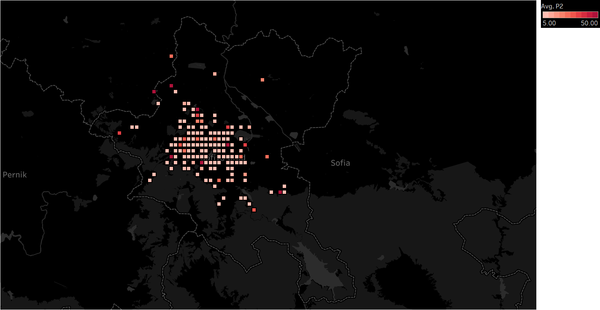
The topography map of Sofia city shows that it is situated in the bottom of a deep valley between high surrounding mountains. P1 and P2 pollutant concentration levels tend to rise and intensify towards the center of the city of lower elevation as indicated by the red hot-spots in the figures below. Although the air pollution in Sofia may be caused by human activity factors and further aggravated by temperature inversion factors, it's location in the Sofia valley by being surrounded by mountains also poses a serious problem because it also reduces the ability of the air to self-clean.


Relationship between Air Quality Pattern and Local Energy Sources
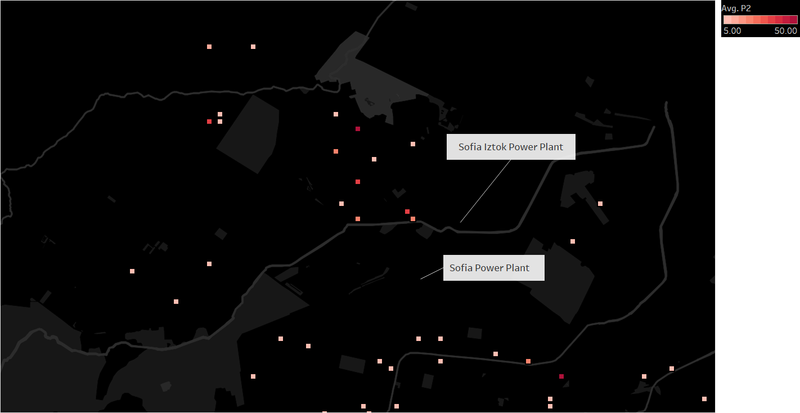
Production of electricity by burning of coal in thermal power plants is also a major contributor to unhealthy air in Sofia. It is observed that the the pollutant level concentrations of Sofia, indicated by the red hot spots in the plot below, is high around Sofia Power Plant and Sofia Iztok Power Plant. This finding identifies the potential sources of pollutants and degree of air pollution contributed by the thermal power plants in Sofia city. As such, management strategies to move away from coal energy and relying on renewable energy sources should be suggested.

