Difference between revisions of "Kou Task2"
(Created page with "<!--MAIN HEADER --> {|style="background-color:#1B338F;" width="100%" cellspacing="0" cellpadding="0" valign="top" border="0" | | style="font-family:Century Gothic; font-size:...") |
|||
| Line 25: | Line 25: | ||
<br/> | <br/> | ||
| − | <font size = 5>''' | + | <font size = 5>'''Task2'''</font> |
| − | == | + | == Geographical Data of Sensors == |
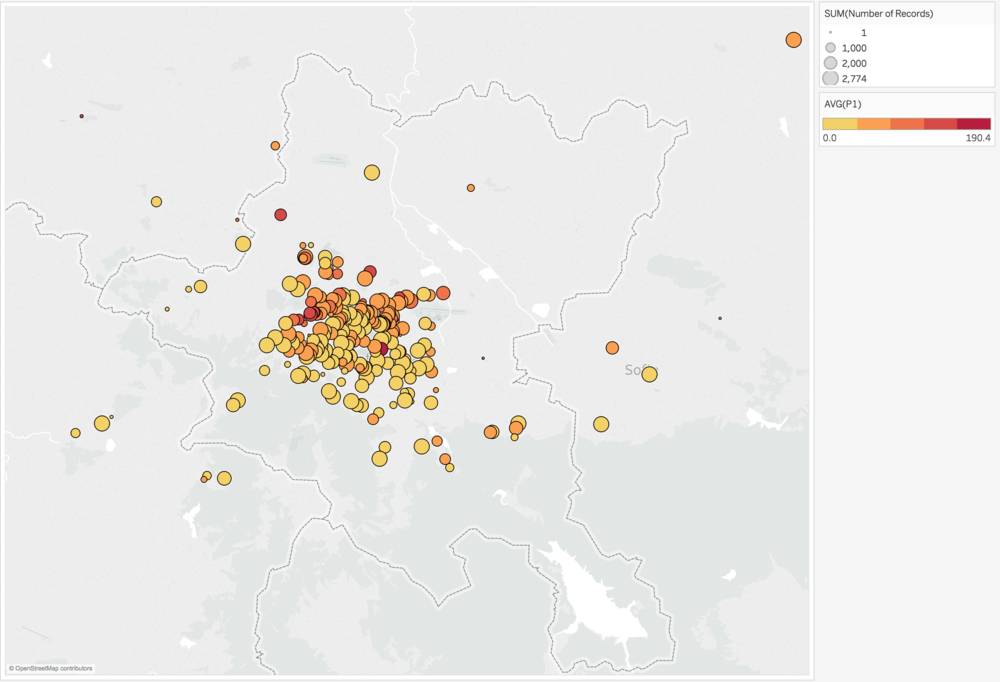
| − | This is the | + | This is the geographical data of sensors. The large circles mean there are many records from the point, and red points show high PM10 and orange indicate low PM10. We can see that remote areas do not have many sensors. Especially, the north-west area has one high-concentration point but there seem to be fewer sensors. I believe that they should increase sensors in the area. |
| − | The | ||
| − | [[File: | + | [[File:FIg4 image.png|1000px|frameless|center]]<br> |
== Monthly Average == | == Monthly Average == | ||
Revision as of 16:44, 18 November 2018
|
|
|
|
|
|
Task2
Geographical Data of Sensors
This is the geographical data of sensors. The large circles mean there are many records from the point, and red points show high PM10 and orange indicate low PM10. We can see that remote areas do not have many sensors. Especially, the north-west area has one high-concentration point but there seem to be fewer sensors. I believe that they should increase sensors in the area.
Monthly Average
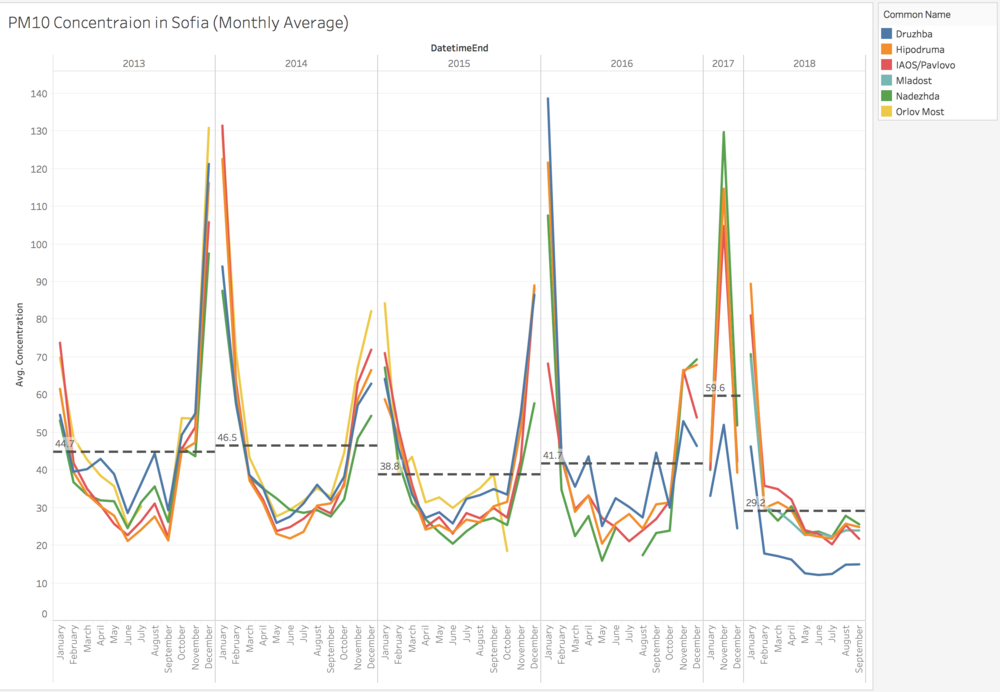
Below is the monthly average data for break down of the data above. The same type of change happens every year, which is the decline of the concentration in summer and high concentration in winter.
Typical Day of Sofia about PM10
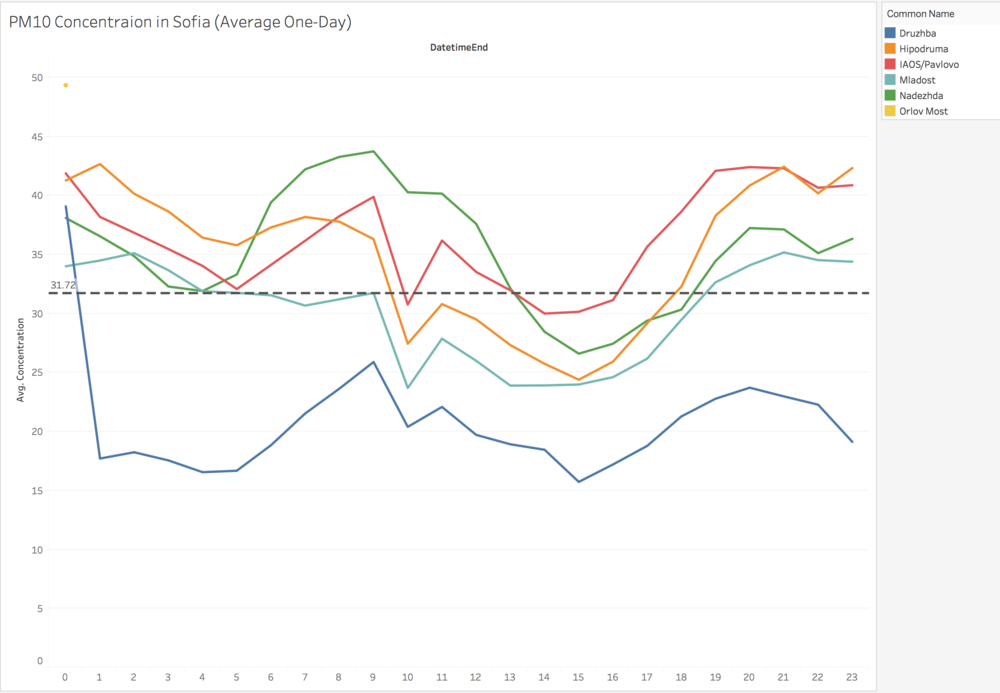
The data shows the average one-day concentration in Sofia City. Interestingly, Druzhba's concentration is especially low from midnight to early morning compared to the other stations. The reason seems that the station is located in a local area and less crowded.


