ISSS608 2018-19 T1 Assign Stanley Alexander Dion
|
|
|
|
|
|
Problem Overview and Scope
Imagine waking up on a day when the first thing that you sense is a dried throat and the smell of smog! Yeah that happens quite often in Sofia City, the capital of Bulgaria, a city where your haze monitor can easily show you a measurement as worst as 6 times the allowed concentration intake of Air Pollution. Air pollution can take in many forms: starting from gasses, biological molecules, as well as Particulate Matter (PM).
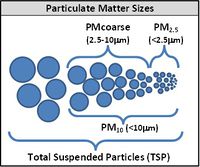
In Sofia city, PM pollutants are not a newly formulated problem. Researchers have been identifying different types of PMs along with its underlying composition and mixtures. Yet the pollution problem has never ceased to exist up until today. Based on size, particulate matter is often divided into three main groups:
- The coarse fraction contains the larger particles with a size ranging from 2.5 to 10 µm (PM10 - PM2.5).
- The fine fraction contains the smaller ones with a size up to 2.5 µm (PM2.5)
- The ultrafine particles in the fine fraction which are smaller than 0.1 µm.
To set a standard for air quality index, we would refer to Bulgaria-EU Air Quality Index with some modified level names. Below is the list table:
| Concentration | Category |
|---|---|
| 0–50 | Level 1 Excellent |
| 51–100 | Level 2 Lightly Poluted |
| 101–150 | Level 3 Moderately Polluted |
| 151–200 | Level 4 Highly Polluted |
| 201–300 | Level 5 Very High Pollution |
| > 300 | Level 6 Hazardous |
One thing for sure for such small particle inhaled with high quantity; it can go through our nose filter and its irregular shape will cause it stuck deep in the lungs. The bigger the size the more it will stick and cause lungs irritation that will lead to human lungs cancer and death.
Air quality in Bulgaria is a big concern: measurements show that citizens all over the country breathe in air that is considered harmful to health. For example, concentrations of PM2.5 and PM10 are much higher than what the EU and the World Health Organization (WHO) have set to protect health. Bulgaria had the highest PM2.5 concentrations of all EU-28 member states in urban areas over a three-year average. For PM10, Bulgaria is also leading on the top polluted countries with 77 μg/m3on the daily mean concentration (EU limit value is 50 μg/m3).
According to the WHO, 60 percent of the urban population in Bulgaria is exposed to dangerous (unhealthy) levels of particulate matter (PM10).
There are many studies conducted by researchers to solve the current pollution problem. One of the approaches used is to analyse the complex compositions of the PM in hope to find the producer of such matter. The study was conducted by Veleva and Hristova, et.al.(2015) and have correlated the elemental compositions of PM but yet they don't study the effect of the local meteorological factor within the sub-region of Sofia. Hence, we will complement their study by putting greater emphasis on studying the Spatio-Temporal pattern in PM concentration across Sofia City and to understand the interactions with weather and the city topology that can help us answer the source and potential answer to eliminate the ever-existed pollution.
Objective of Tasks
Task 1
In hope to get the progress of improvement in Sofia City, we would like to characterize the past and most recent situation with respect to air quality measures in Sofia City that will answer the following questions:
- What does a typical day look like for Sofia city? Any trends of possible interest in this investigation?
- What anomalies can we find in the official air quality dataset and how do these affect your analysis of potential problems to the environment?
Task 2
Utilizing a more detailed lookup into the city within the data by Citizen Science community, we would like to know the city one step more detail and answer the following questions:
- Which part of the city shows relatively higher readings than others?
- Are these differences time dependent?
But first, we need to ensure the quality of the observation made by the Science Community. Therefore, we would ensure some of the followings:
- Are the sensors well distributed over the entire city? Are they all working properly at all times?
- Any unexpected behaviours of the sensors by analyzing the readings they capture?
Task 3
Combining all the analysis into view, we need to reveal the relationships between the factors mentioned above and the air quality measure detected the preceeding tasks. Since Urban air pollution is a complex issue, the following line of investigation should be our guidance:
- Interaction with Local energy sources. For example, according to Unmask My City, a global initiative by doctors, nurses, public health practitioners, and allied health professionals dedicated to improving air quality and reducing emissions in our cities, Bulgaria’s main sources of PM10, and fine particle pollution PM2.5 (particles 2.5 microns or smaller) are household burning of fossil fuels or biomass, and transport.
- Interaction with Local meteorology such as temperature, pressure, rainfall, humidity, wind etc
- Interaction with Local topography
- Complex interactions between local topography and meteorological characteristics
- Transboundary pollution, for example, the haze that intruded into Singapore from our neighbours

