ISSS608 2018-19 T1 Assign Song Chenxi Task 1
|
|
|
|
|
|
Task 1: Spatio-temporal Analysis of Official Air Quality
Characterize the past and most recent situation with respect to air quality measures in Sofia City. What does a typical day look like for Sofia city? Do you see any trends of possible interest in this investigation? What anomalies do you find in the official air quality dataset? How do these affect your analysis of potential problems to the environment?
Your submission for this questions should contain no more than 10 images and 1000 words.
Part A Past and most recent comparison
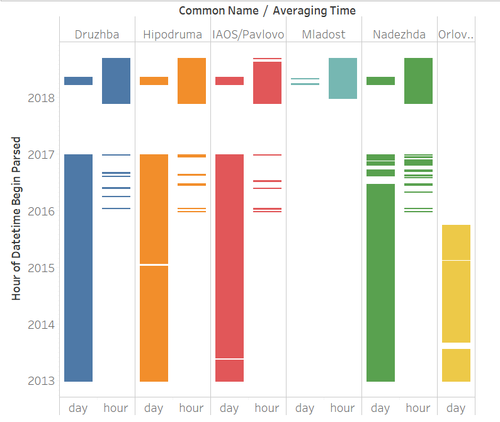
In this graph, x-axis is “averaging time” type and y-axis is daily time records changing from 2013 to 2018.
The different color indicates different stations.
In the past from 2013 to 2016, there were 5 stations, each of them used daily measurement method.
From 2016 to 2017, one station called “Orlov Most” closed and four stations all began to use a combination of daily and hourly measurement.
Recently, from 2017 onwards, all stations use hourly as the main methods along with daily menthods, in the same time, a new station called “Mladost” launched.
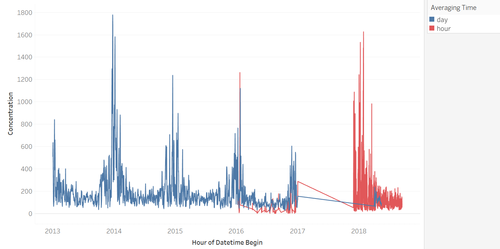
From the end of 2015, stations began discontinuous use hourly measurement and they began to reuse measured daily again in 2018.
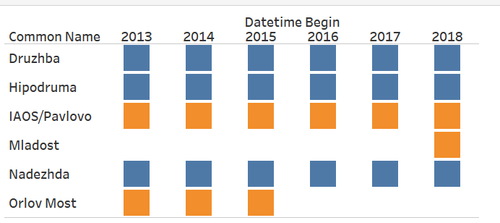
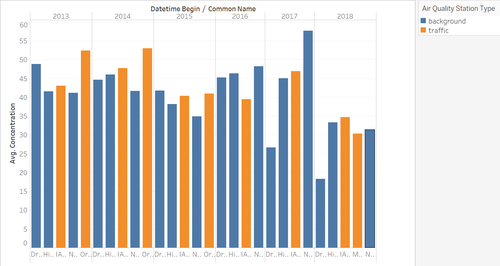
In this chart, orange is traffic air quality station and blue is the background air quality station.
From 2016 they closed a traffic one until 2017 and opened a new traffic station in 2018, which probably due to the more serious traffic pollution trends.
Traffic stations have been classified as 'located such that its pollution level is determined predominantly by the emissions from nearby traffic (roads, motorways, highways)'. Background stations are not influenced significantly by single sources but by an integrated contribution from all sources.
From 2018, the traffic seems to be predominantly impact the air pollution.
Part B calendar heatmap
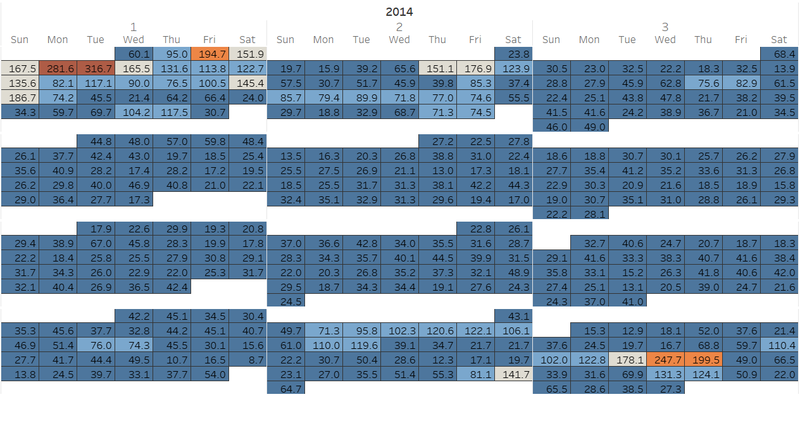
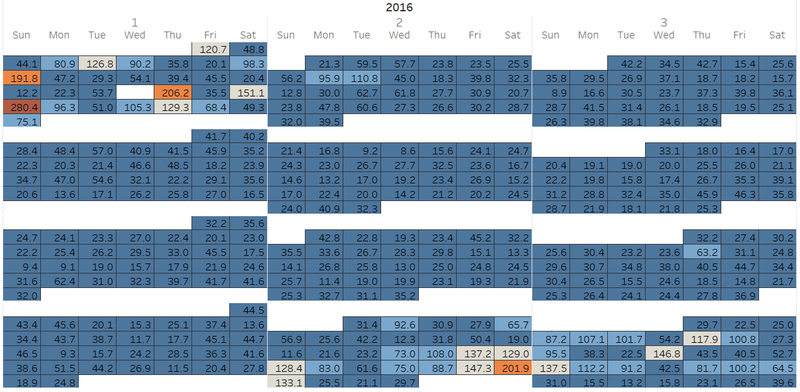
To analyze whether air pollution concentration is determined by temperature, I build the calendar map to show the time series. From the calendar, we can easily observe that the higher concentration all mainly distributed among January, February, Nov and Dec.
Part C station
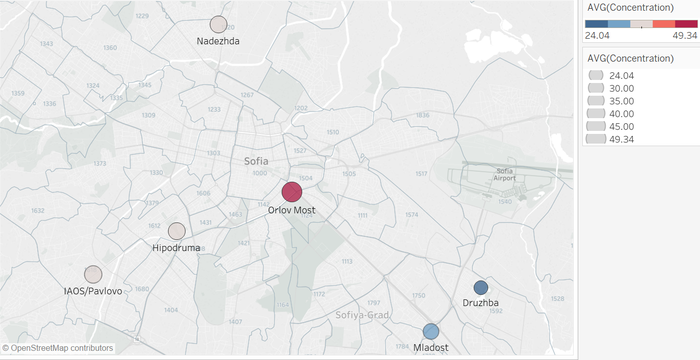
For different station, we can observe that the Orlov Most has the highest level of average pollution followed by IAOS/Pavlovo. After exploring the data, we can find that all these two stations are traffic stations.
Part D daily observation
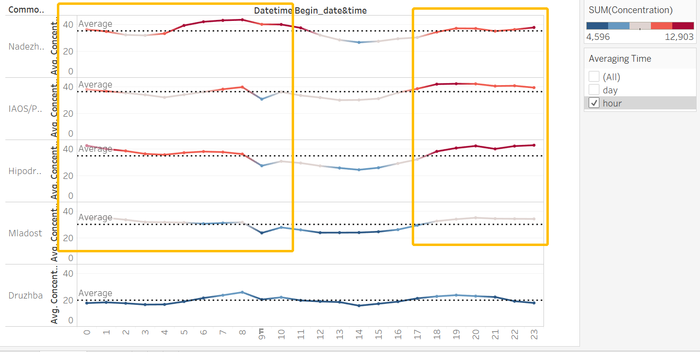
After selecting the daily measurement, we can observe the daily trend hour by hour. Also, for most of the stations, the air pollution is comparatively terrible at 4 to 10 am and after 6pm.
