ISSS608 2018-19 T1 Assign Charu Malik DataPrep
|
|
|
|
|
|
Contents
Data Preparation
The visualizations created for this project make use of 4 distinct datasets. An overview of the data preparation and univariate analysis for these will be covered in this section. The datasets and corresponding analysis have been prepared using JMP Pro 13, Tableau, R and Excel.
A brief description of all 4 datasets and preparatory steps is given below:
Official Air Quality Measurements
This dataset consists of 28 separate files with PM10 concentrations levels from 2013 to 2018 at the 6 different official air quality stations and an additional metadata file which specifies the Latitude and Longitude of these stations. A single complete dataset was created with an inner join, using the AirQualityEOLStationCode as the key.
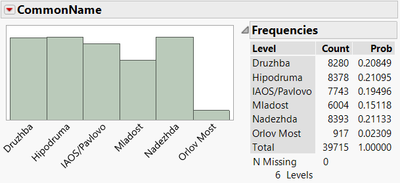
| There are 6 official air quality stations in Sofia from where readings have been captured. Mladost is the newest station which has recently become operational after readings from Orlov Most ceased. | |
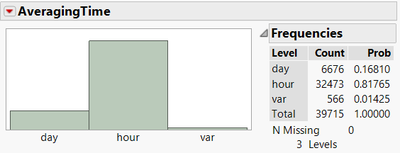
| Readings are taking as a mixture of daily and hourly readings. ‘var’ refers to readings which are not taken at a constant time interval. For simplicity, we will be using the average of all hourly readings to present an average daily concentration value. | |
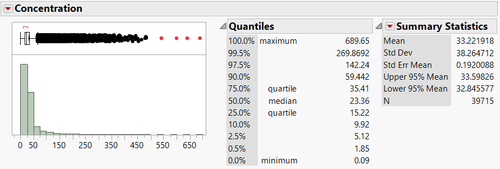
| Univariate analysis of the readings also show that the measure of chemical readings is highly skewed. It is noteworthy to highlight the degree of skewness by stating that the 99.5th percentile measure is 269.8692 while the maximum value is 689.65. The median reading is at 23.36. |
Citizen Science Air Quality Measurements
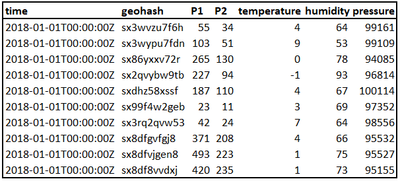
This dataset consists of 2 large sized files with 2017 and 2018 data on concentrations of P1, P2 and the Temperature, Humidity and Pressure at a particular geohash.
Geohash is a geocoding system which encodes location into an alphanumeric string. For use in tableau, it is necessary to convert geohash into latitude and longitude convention. Geohash package in R was used for this conversion. The format of the data can be seen in this figure:
| Upon closer examination, we can see that the distributions of P1 (PM10) and P2 (PM2.5) are highly skewed with many records having the maximum possible readings for a given sensor. These readings are erroneous and should be removed from our dataset. | |
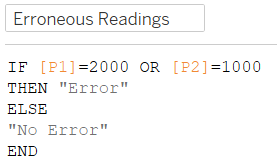
| We will filter these off in Tableau using the following logic created in a calculated field. | |
| |
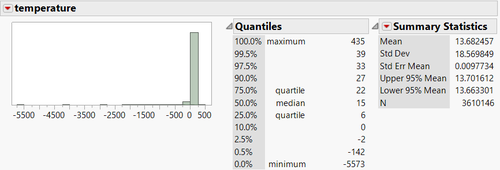
The temperature in this dataset is represented in °C however we still see some impossibly high and low temperature readings. External weather data states temperature ranging from -5 °C to 29°C over the last 30 years in Sofia. We will conservatively take an additional 10°C range. All other readings outside of this range will be considered erroneous. |
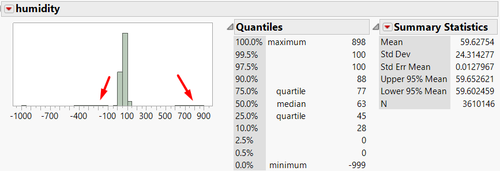
| Humidity follows a general pattern of normal distribution as seen below except for the two outlying regions marked with arrows. These values will be filtered away as erroneous. | |
| |
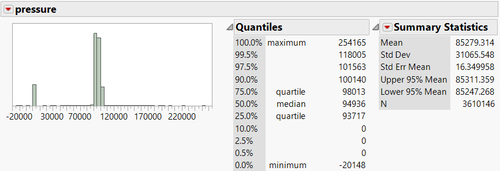
For pressure, we see a significant number of erroneous readings at the 0 value. We will only select those values which are within the 0.5%-99.5% range for further examination. |
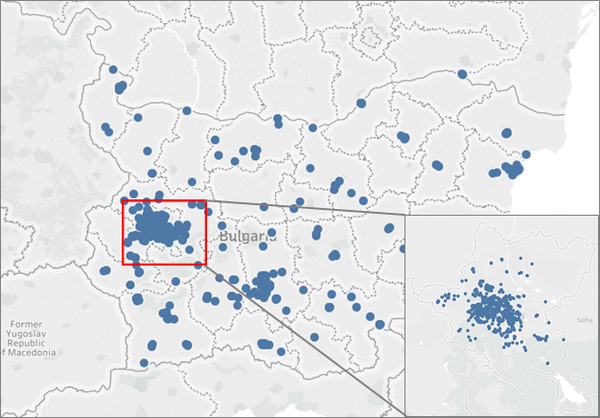
| The dataset consists of information for the whole of Bulgaria, not only limited to Sofia. We can select the information we are interested in by using the lasso tool in Tableau to select only the points that fall within the boundary of Sofia. |
Meteorological & Environmental Factors
To create the dataset for analysis we will aggregate readings for PM10 at the daily level the official and citizen science air quality dataset. We will have date, concentrations, stations names, latitude and longitude for each station from this dataset. Meteorological data is already available at a daily level and will be joined using the date as a unique identifier. The dates of interest will be restricted to those years for which we have readings from all days (2013 – 2016). This is done in order to be able to capture seasonality of concentration readings in the timeseries charts which will be presented.


