Group11 Proposal
|
|
|
|
|
|
Background
Citi Bike is New York City’s bike share system and the largest in the nation. Citi Bike launched in May 2013 and has become an essential part of our transportation network. It’s fun, efficient and affordable-not to mention healthy and good for the environment.
Citi Bike, like other bike share systems, consists of a fleet of specially designed, sturdy and durable bikes that are locked into a network of docking stations throughout the city. The bikes can be unlocked from one station and returned to any other station in the system, making them ideal for one-way trips. People use bike share to commute to work or school, run errands, get to appointments or social engagements, and more. It is operated by motivate, the global leader in bike share.
Citi Bike is available for use 24 hours/day, 7 days/week, 365 days/year, and riders have access to thousands of bikes at hundreds of stations across Manhattan, Brooklyn, Queens and Jersey City. So Citi Bike is the best way to see NYC. If you are visiting showing guests around or just want to be a tourist in your own town, check out these popular rides, local attractions and events.
Objective
The objective of this project is to better present bike trip and bike stations data to Citi Bike and citizens in New York city by using visual analysis and reporting. By looking at our dashboard, it will be easy for citizens to find out which bike station they can borrow or return bikes, which station is in operation now, where and when Citi biker ride, how far they go. It will also be easy for Citi bike to find out the most popular bike stations and think about the geographical distribution of bike stations. Besides, our dashboard is aimed to auto-refresh and present the most recent and accurate bike station and trip data.
Dataset
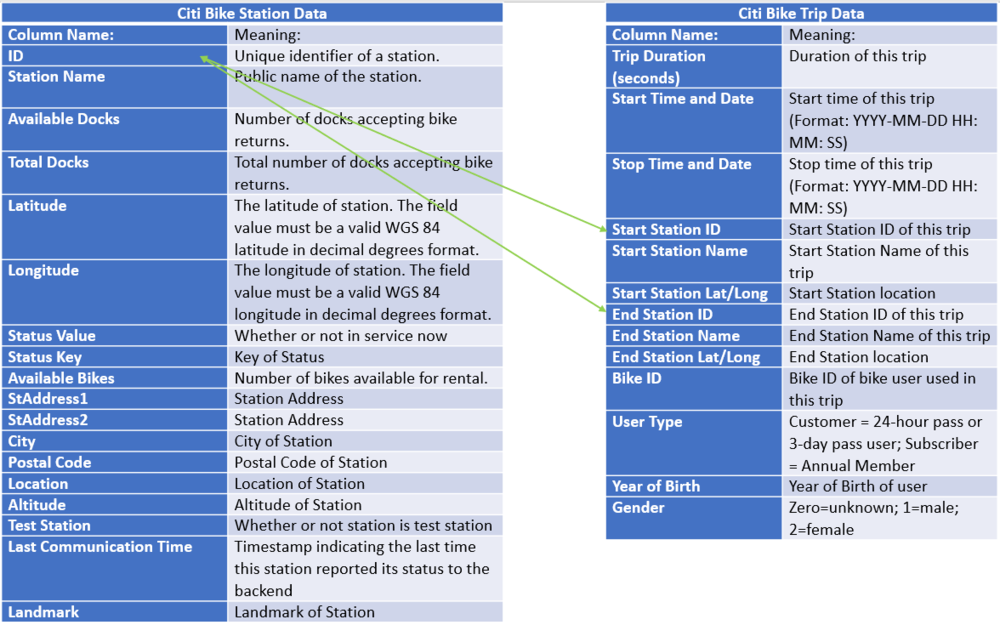
The project we chose is from Kaggle website, which the link is: https://www.kaggle.com/nycopendata/new-york/home. We choose citibike_stations and citibike_trips datasets to use in our projects. According to Kaggle, we need to query the dataset by ourselves, so we import citibike_stations from https://data.cityofnewyork.us/NYC-BigApps/Citi-Bike-Live-Station-Feed-JSON-/p94q-8hxh . We are using R language to read this JSON file. We also download citibike_trips datasets from https://www.citibikenyc.com/system-data. These two datasets contain information about the bike stations and bike trips in New York city.
Methodology
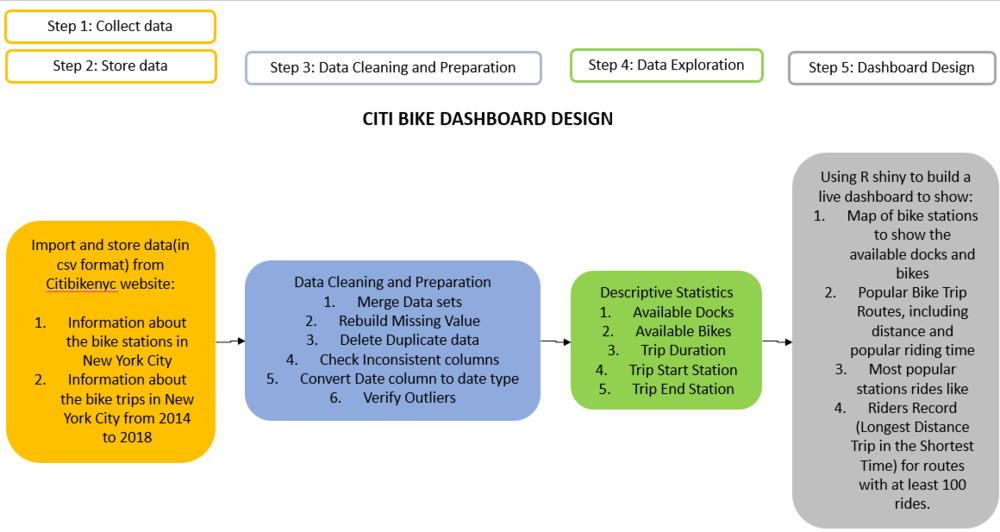
The flow chart below depicts the approach which consists of 5 steps to collect/store, clean/prepare, explore and building dashboard using appropriate techniques.
References
[1] https://www.citibikenyc.com/about
[2] https://untappedcities.com/2013/10/29/fun-maps-citi-bike-data-visualizations-first-100-days
[3] https://www.citibikenyc.com/system-data
[4] https://www.kaggle.com/nycopendata/new-york/home
[5] https://www.quora.com/What-steps-should-be-included-in-a-data-cleansing-process


