IS428 AY2018-19T1 Arivazhagan Karunakaran
Contents
Problem & Motivation
Air pollution is an important risk factor for health in Europe and worldwide. A recent review of the global burden of disease showed that it is one of the top ten risk factors for health globally. Worldwide an estimated 7 million people died prematurely because of pollution; in the European Union (EU) 400,000 people suffer a premature death. The Organisation for Economic Cooperation and Development (OECD) predicts that in 2050 outdoor air pollution will be the top cause of environmentally related deaths worldwide. In addition, air pollution has also been classified as the leading environmental cause of cancer.
Air quality in Bulgaria is a big concern: measurements show that citizens all over the country breathe in air that is considered harmful to health. For example, concentrations of PM2.5 and PM10 are much higher than what the EU and the World Health Organization (WHO) have set to protect health.
Bulgaria had the highest PM2.5 concentrations of all EU-28 member states in urban areas over a three-year average. For PM10, Bulgaria is also leading on the top polluted countries with 77 μg/m3on the daily mean concentration (EU limit value is 50 μg/m3).
According to the WHO, 60 percent of the urban population in Bulgaria is exposed to dangerous (unhealthy) levels of particulate matter (PM10).
Dataset Analysis
- Official air quality measurements (5 stations in the city)(EEA Data.zip) – as per EU guidelines on air quality monitoring see the data description
- Citizen science air quality measurements (Air Tube.zip), incl. temperature, humidity and pressure (many stations) and topography (gridded data).
- Meteorological measurements (1 station)(METEO-data.zip): Temperature; Humidity; Wind speed; Pressure; Rainfall; Visibility
- Topography data (TOPO-DATA)
Dataset Preprocessing
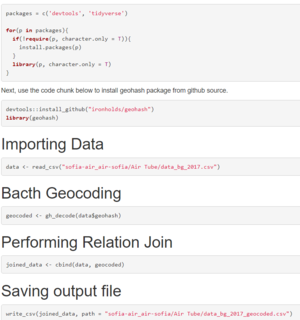
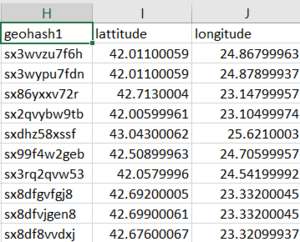
- Given dataset data_bg_2018.csv contains Geohashes. We need to convert them into geographical data.
- Geohashes are decoded into Geo Longitude and Latitude respectively with the help of R programming.
Time series data Preprocessing
- In Timeseries data, the data file affected includes: Station 60881 and Station 9484. Both the data files miss essential data. So, both data files will be excluded from the visualization.
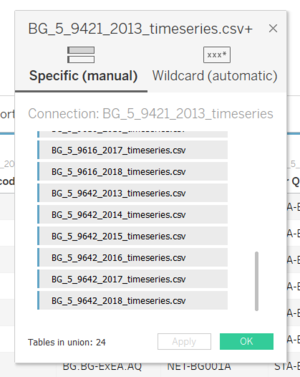
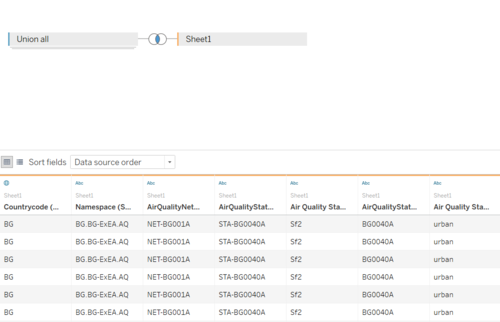
- Tableau can merge the data together using the union features. Subsequently, we can inner join the data based on the Station EoI Code.
Task 1: Spatio-temporal Analysis of Official Air Quality
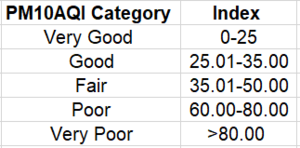
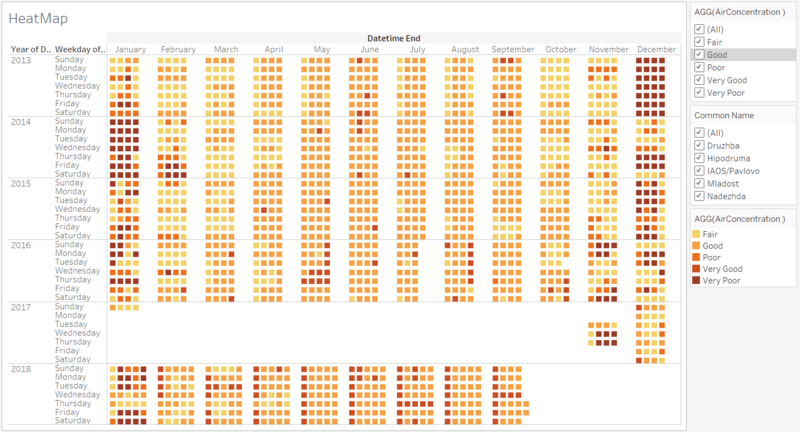
In order to see a typical day in Sofia, I plot a calendar heatmap of average concentration, divided by year, week day and over the months in a year. The values are organised into calculation fields as per the PM10 CAQI breakpoints,
Visual Detective Findings:
- From the Heatmap representation, we can identify that Sofia City is facing a high level of concentration of PM10.
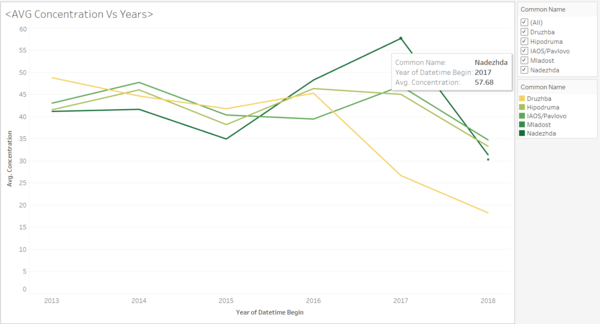
- According to the Concentration by Station chart, all the 5 stations seem to have similar patterns in the change in concentration throughout the hours.
- It is noticed that Nadezhda has the highest concentration level vs Druzbha has the lowest concentration from year 2013-2018.
- We can notice that all stations had an extremely high concentration level in December, January and early February, and started to drop further over the later months.
- When we use filter tool and watch each year. we find that, it is applicable to previous years as well - from December 2013 to January 2014, each of the stations peaked the highest concentration levels.
- In conclusion, In Sofia city, an average day is of moderate level of PM10 concentration. The beginning and end of year seems to have worst air quality and the worst days happen on holidays. But we see, over the years the PM10 concentration has been decreasing.
Task 2: Spatio-temporal Analysis of Citizen Science Air Quality Measurements
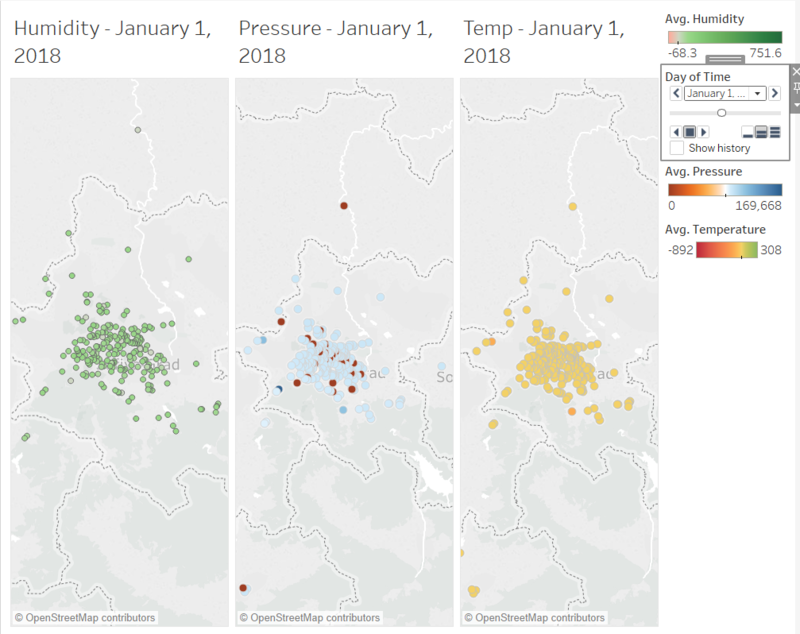
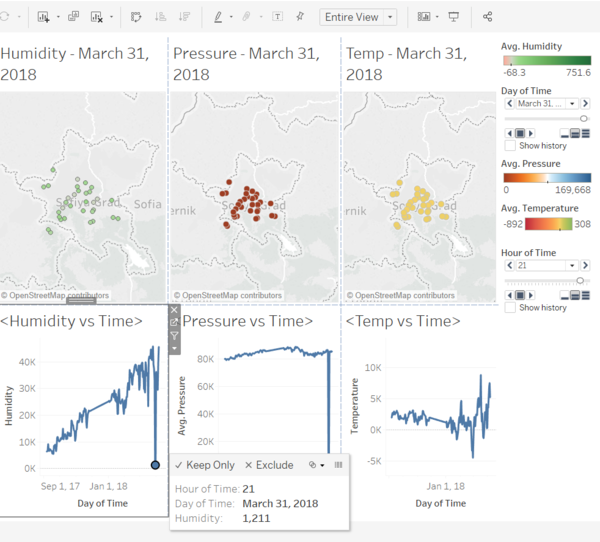
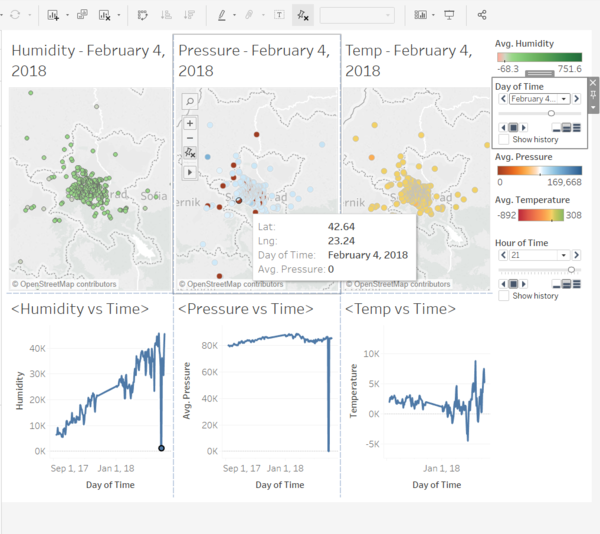
- The below chart represents the latitudes and longitudes of Sofia city and its nearby cities.
- The graph is obtained by plotting Humidy vs Pressure vs Temperate and days per year respectively.
This dashboard shows sensors and their readings in Sofia City. When choosing a sensor, we can find the sensor readings at different times of the day and user can tell when the sensors are not working properly.
Visual Detective Findings:
On 31 march 2018 & 1 April 2018, the sensor humidity reading had a sharp drop from avg humidity 35,561 to 0 degree, which is not reasonable. At the same there was sudden decrease in time, pressure and humidity readings suggesting that the sensor might have a problem on 31 march 2018.
On 4 February 2018, the sensor temperature reading had a sharp drop from 20 degree to 0 degree at 10AM, which is not reasonable. At the same there was sudden increase in time, pressure and humidity readings suggesting that the sensor might have a problem on 10 AM, 4 February 2018.
