ISSS608 2017-18 T3 Assign Harisingh Q1
To characterize the past and most recent situation with respect to chemical contamination in the Boonsong Lekagul waterways, we can focus our attention on how the number of readings has varied with time for different chemicals. This is based on my understanding that changes in number of observed readings for a chemical is analogous to its contamination.
Overall Trend Chart
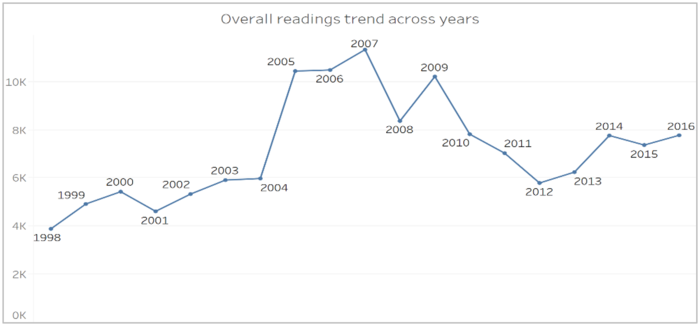
The below time-series plot suggests that number of readings observed were not consistent for the given time-frame. Though I notice an upward trend in number of readings until 2007, there has been a drop into readings in recent years.
Sample Analysis by Location
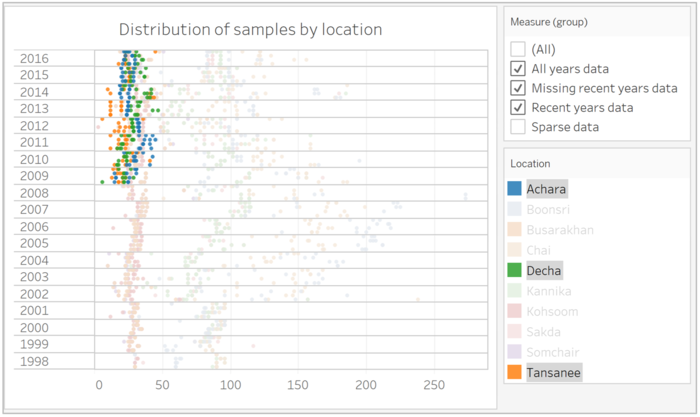
The dot plot gives us more insight on how the readings were collected at location level. Surprisingly, in Achara, Decha, and Tansanee, water samples have been collected since 2009 onward.
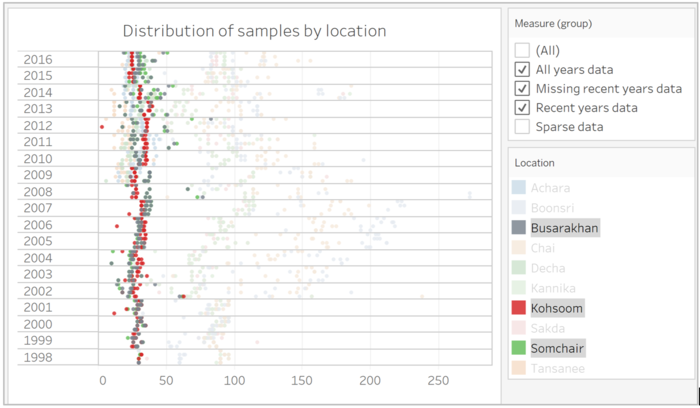
On the other hand, for Busarakhan, Kohsoom, and Somchair, the readings were collected consistently across years.
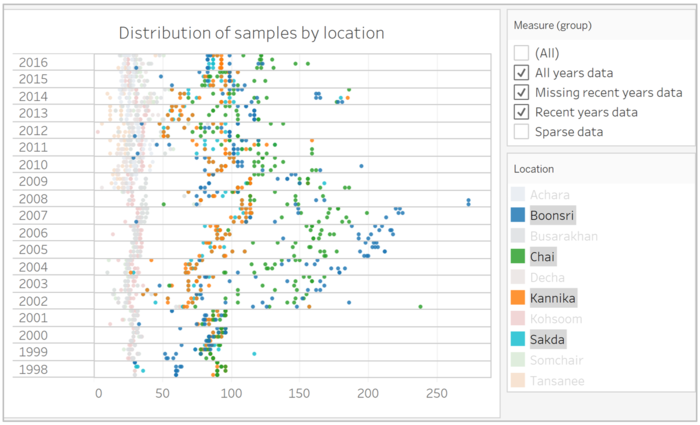
Lastly, in remaining locations, we notice relatively very high variation in number of readings. Interestingly, all of these locations lie on same river path where different streams converge.


