ISSS608 2017-18 T3 Assign LI Yaru Data Preparation
|
|
|
|
|
Mapping Location
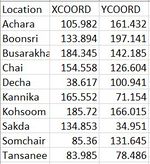
To enhance geographical visualization, the maps labelled sampling location should be included in Tableau. Creating a location csv file to build coordinate system by manually set coordinate for four edge corners.
In Tableau, the “Location” file is imported and x-coord and y-coord are served as geographic role to accommodate background map. Once the background map has been loaded, annotation would give corresponding coordinates for each pin-down, and by moving the annotation, we could record all the location coordinate into the location file, shown as below.
 ==>
==> 
Having set up the actionable map, then import measure reading record (Boonsong Lekagul waterways readings.csv) to tableau by right join, thus location records in reading file are all mapped in Tableau. To explore the recorded duration for each measure, we introduce a file called Duration and the file chemical units of measures.csv is also included for reference.

Unfold Measures
All the measures are under single dimension called Measures, it is hard to get summary and correlation across multiple measures, so to unfold the measure, we could get preliminary analysis about measures.
Using JMP Pro to split column measures, grouped by location and date, indicating that we only retain one record of each measures for each location in a day. Although some measures are recorded multiple times a day, we keep single record to standardized timeframe. After splitting, one measures is a single dimension, the column landscape changed to be flat.
500px
