ISSS608 2017-18 T3 Assign ONG WAH JIE Data Visualization
ISSS608 Assignment Vast Challenge Mini-Challenge 2 Ong Wah Jie
|
|
|
|
|
|
Contents
Waterway Map
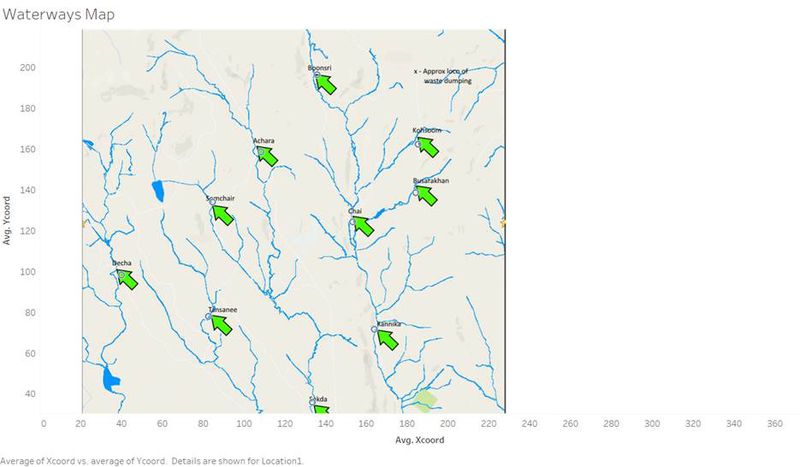
The map of the locations where the water sensor readings were taken is shown here, along with the approximate location of the waste dumping.
Hovering on the circle located at the tip of the arrows will review the x and y coordinates of the locations.
Calendar Plot
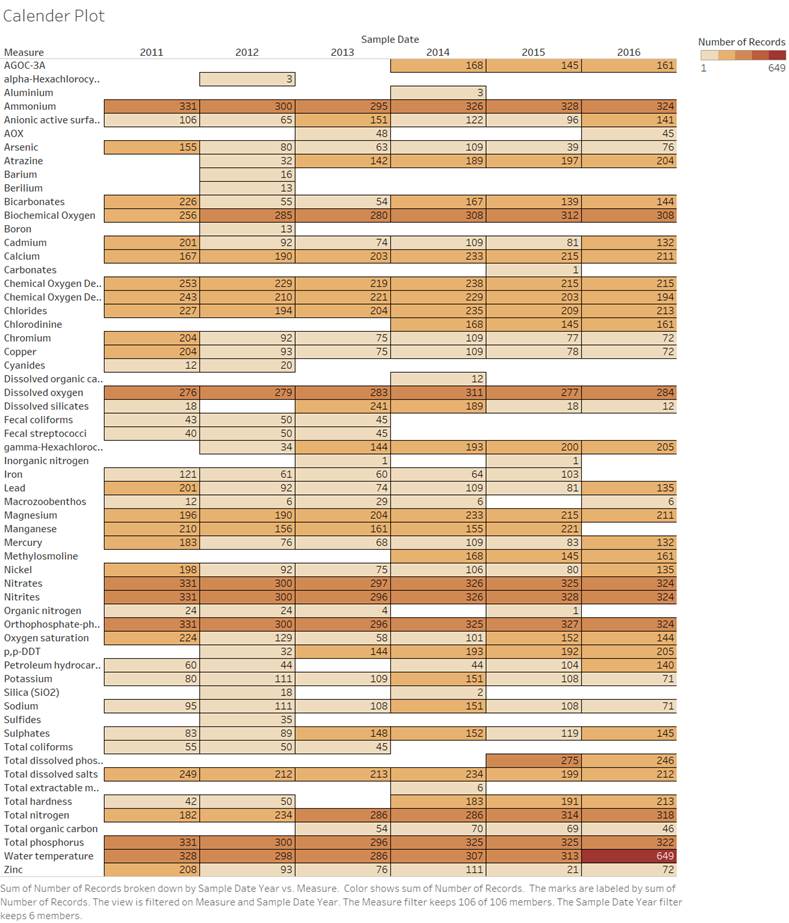
The calendar plot was drawn to come up with the chemicals which had any yearly records for the period 2011 – 2016.
From this, it can be seen the number of records each year and which year had records taken.
Chemical (readings)
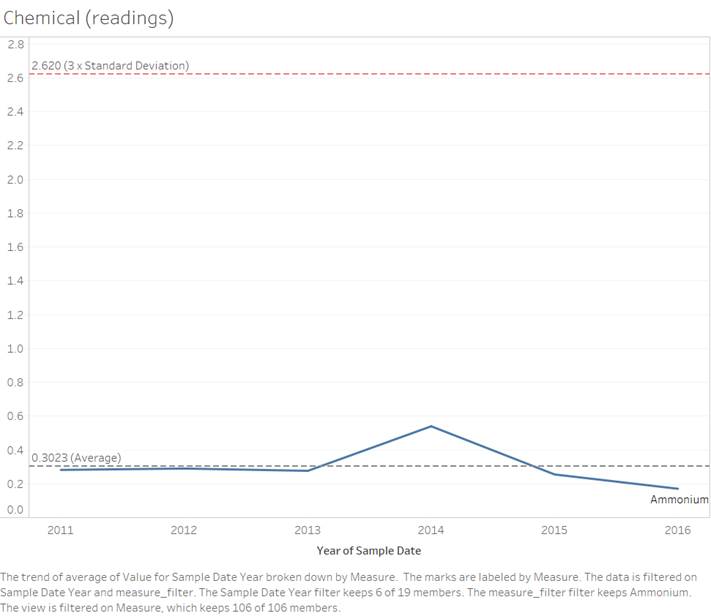
This shows the yearly trend of the chemical readings. The user is able to filter to the chemical that he is interested in.
Chemical (readings by location)
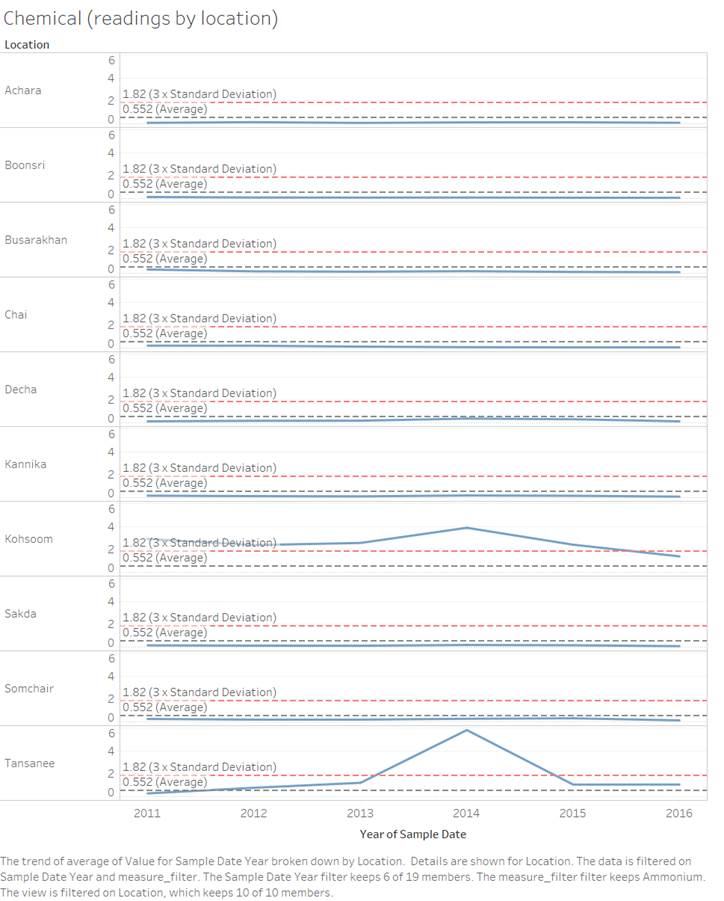
This allows a user drill into more details of the chemical readings by viewing the readings of various locations where the readings were taken.
The user is able to filter on the chemical that he is interested in.
Chemicals Overview Dashboard
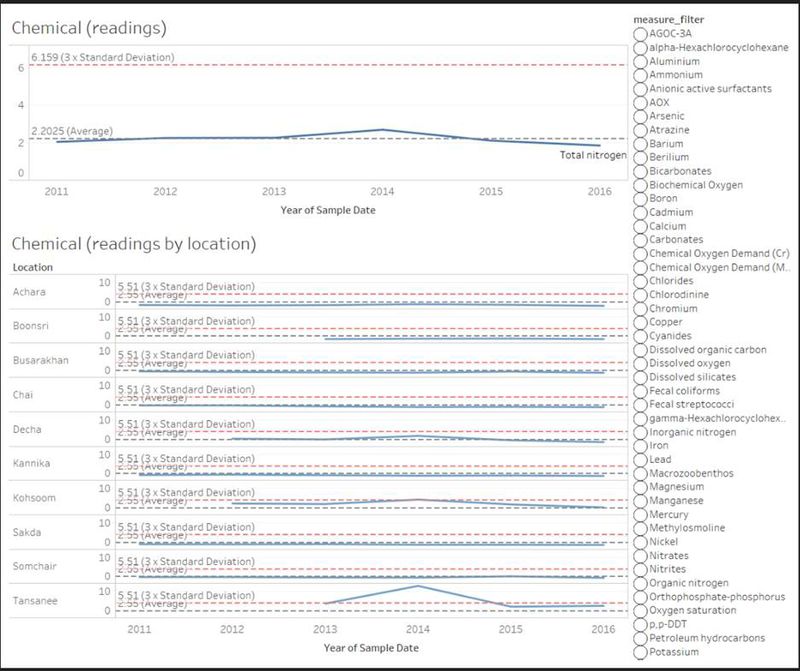
A chemicals overview dashboard was created. This combines the “chemical (readings)” worksheet and “chemical (readings by location)” worksheet
By selecting on the measure filter, the user is able to select the chemical and able to view the trends of the 2 worksheet immediately on this single dashboard.
Access the Tableau File
To access the Tableau file, please click on the link: 2018 Vast Challenge 2
