ISSS608 2017-18 T3 Assign ONG WAH JIE Data Preparation
ISSS608 Assignment Vast Challenge Mini-Challenge 2 Ong Wah Jie
|
|
|
|
|
|
Contents
Data Prep
Creating waterway map and location.csv
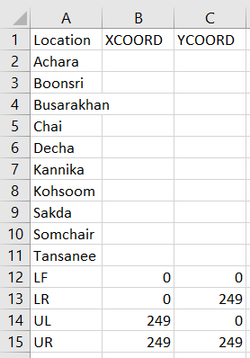
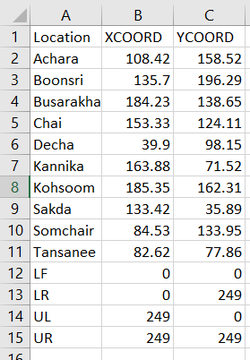
Import a location.csv file as shown below into tableau.
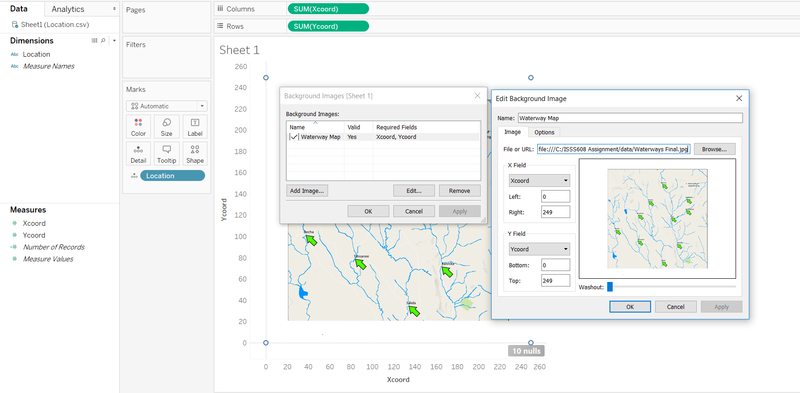
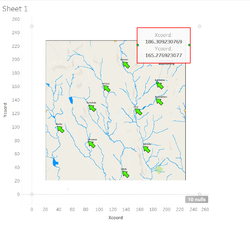
Select according to the print-screen below to get the image of the waterway to appear in tableau.
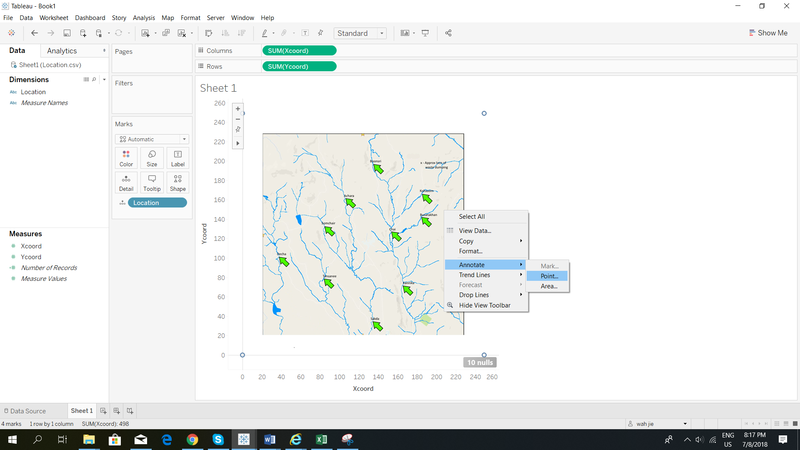
Right click on the map image and select annotate
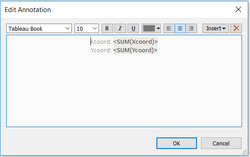
Click ok
Drag line which appears with the box to the tip of the arrows to get the x and y coordinates of the locations.
Populate the locations with the x and y coordinates obtained.
Import data into tableau
The “Boonsong Lekagul waterways readings” file and the “Location” file mentioned above were connected to tableau.
The “left join” function was used to join these 2 data sets together.
Calendar Plot
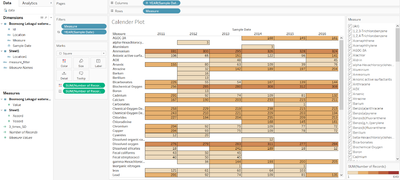
The calendar plot can be created by following the “filters”, “marks”, “columns” and “rows” fields as shown in the diagram below.
The year(sample date) was filtered for the period 2011 – 2016.
Chemical (readings)
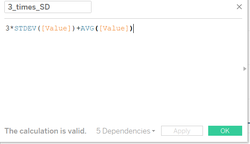
A calculated field 3_times_SD was created to calculate the value 3 times of standard deviation.
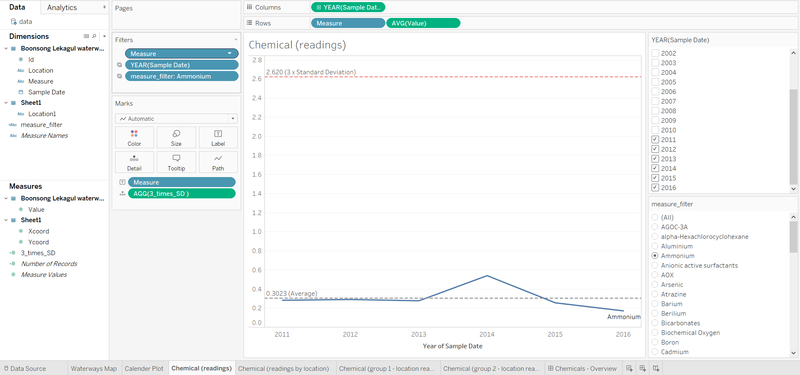
The chemical (readings) can be created by following the “filters”, “marks”, “columns” and “rows” fields as shown in the diagram below.
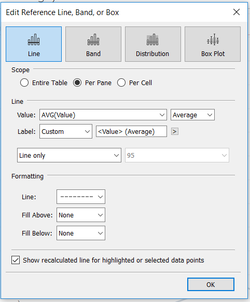
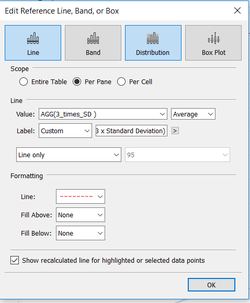
To add in the average line and 3 x standard deviation line above, right click on the y-axis and select add in reference line. The box below will appear.
Do this for average line
Do this for 3x standard deviation line
Chemical (readings by location)
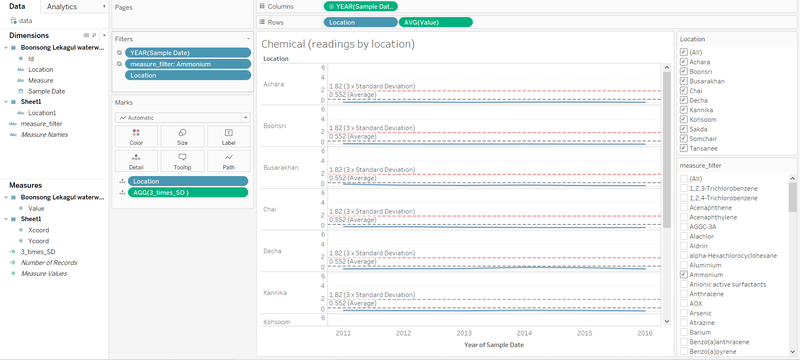
The chemical (readings by location) can be created by following the “filters”, “marks”, “columns” and “rows” fields as shown in the diagram below.
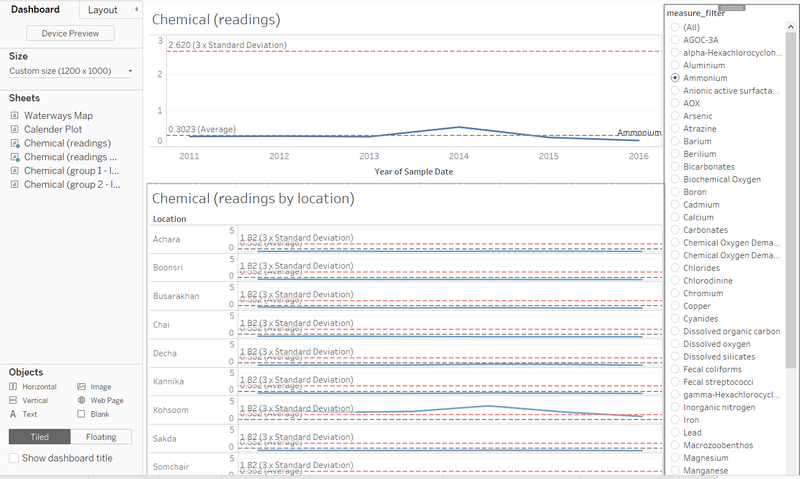
Chemical Overview Dashboard
This was created by dragging the “chemical (readings)” and “chemical (readings by locations)” worksheets into the dashboard as shown in the diagram below.
