ISSS608 2017-18 T3 Kiriti Yelamanchali Background
|
|
|
|
|
|
|
|
For analysis, datasets were provided from researchers, which were obtained from thier website[1]:
Overview of Data
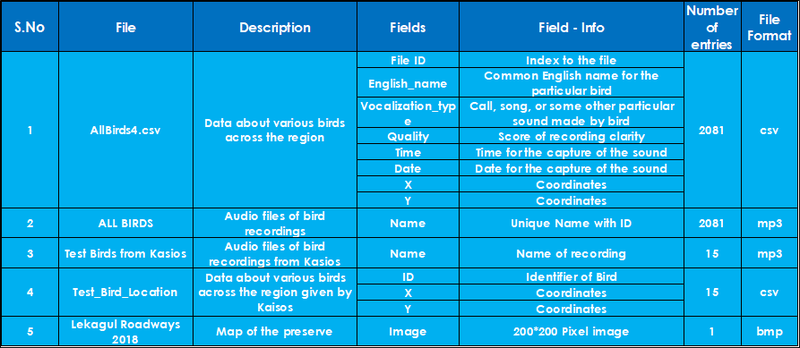
The data files which were obtained and used for analysis are as follows:
The overview could be summarized as follows :
Tools Used
For this data, the data cleaning, analysis and visualizations, were done using the following tools:
- Tableau
- Python
- Librosa (For basic audio processing, and feature extraction)
- sklearn, keras, scipy (For Machine Learning)
- matplotlib (For basic visuals)
- pandas, numpy (For processing)
- Excel (For basic cleaning)
Prelimary EDA
1. Bird Names & Distribution
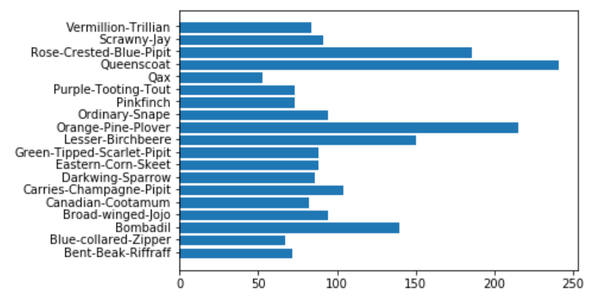
- Loading the data from AllBirdsv4.csv, into Pandas data-frame in Python and with help of matplotlib we can observe that there are total 19 birds in the data, and the distribution is as follows:
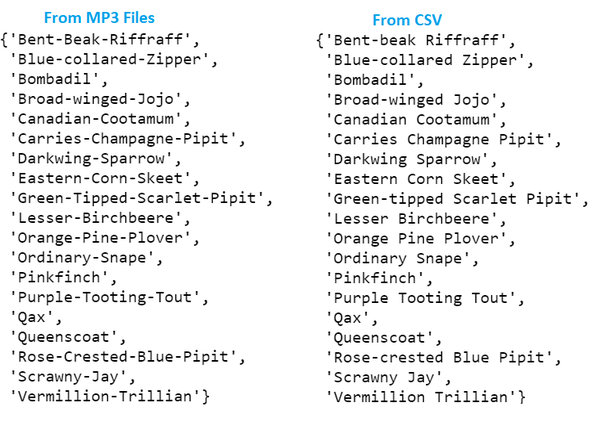
- On further anlaysis, it is found that the names from AllBirdsv4.csv, and in those from mp3 files are a bit different in terms of case, sepration by '-' etc, which is visualized below:
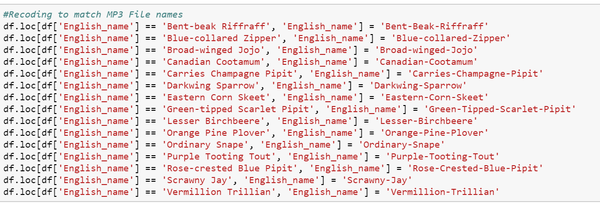
- The csv is loaded into the pandas dataframe and basic cleaning is done in Python as following, to match the names of the birds.
2. Quality of data
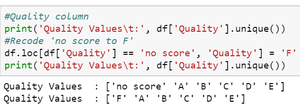
- Using pandas column exploration, it is found that there are missing values in Quality column. A value of 'F' is assigned to the missing data as following :
3. Vocalization Type
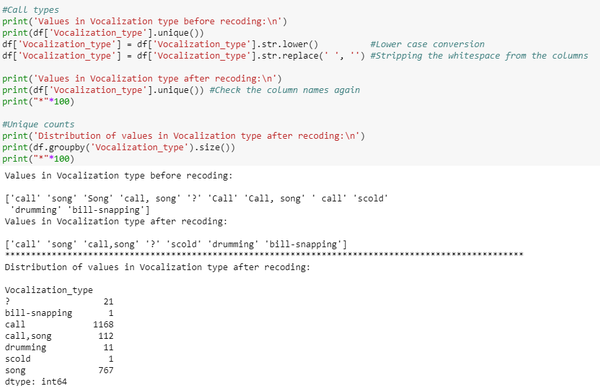
- It is found that there were few missing values and lower and upper casing mixup in this coolumn. It is fixed using pandas as following:
4. Time
- Cleaning the Time data:
Ambiguous patterns in Time column are observed using regex in python as follows:

- These ambiguities are corrected accordingly using the Python observing the patterns such as am/pm/morning/early-morning etc, by refilling them using the corresponding time.
Missing values in time are filled with average between the mean, mode and median of the time patterns.
The code for cleaning the Time Column is as follows :
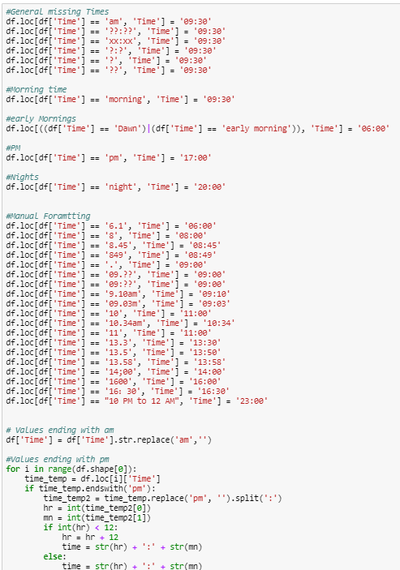
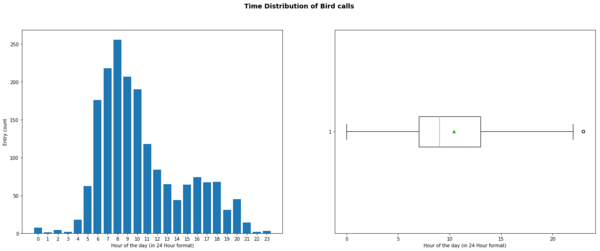
- The time data is plotted using matplotlib, and it is found that the most of the calls are concentrated during the morning times
- Further cleanings are done manually if necessary
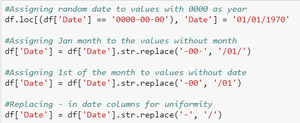
5. Cleaning the 'Date' data: The missing date columns, with missing years/ missing month/ missing day are filled.
- If year is missing, the beginning of UNIX timestamp 1970 - Jan 1st is assigned
- If month is missing, it is coded as January
- If Day is missing, it is coded as 1st of the month.
The python code for recoding can be found as follows:
- Analysis of Date data
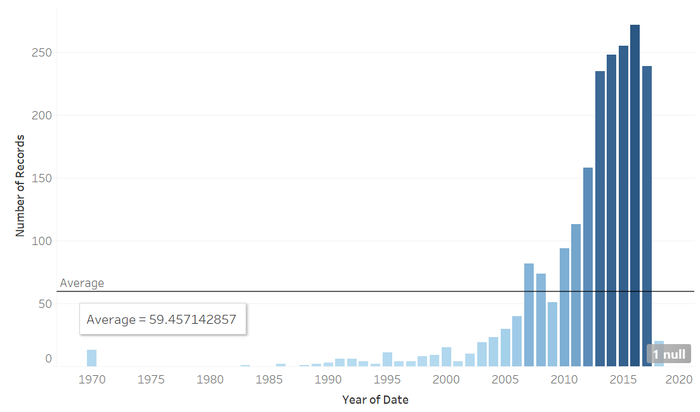
- The year - birds call data is plotted, to observe that the concentration of birds had been highest in the past 10 years. The data for the year 2018 had been very less.
The distribution can be found as follows:
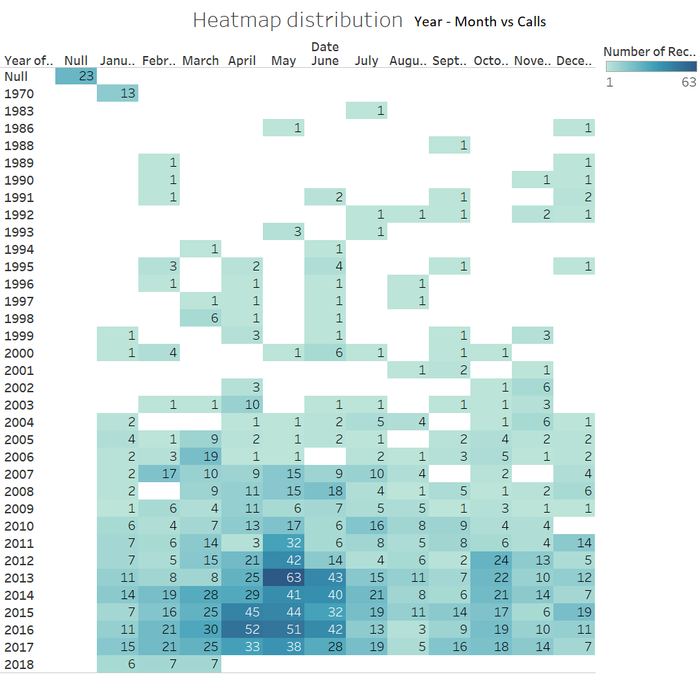
- Another distribution : Heatmap is plotted in tableau, to observe the trends across years and months vs calls
MAP Plotting
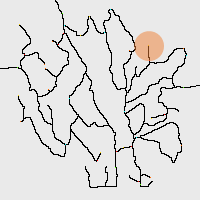
We need to observe if the suspected dumping site is effecting the bird population in the region. This can be done by identifying the area and creating a secondary image, with radius around the dumping area. Creating a secondary image with region marked around the dumping region with a pre-determined radius makes analysis easier.
The image marked with a circular semi-transparent overlay can be obtained as follows:
Insights from EDA
- Most of the ambiguous values are manually corrected and missing values have been filled in with mean/median/mode.
- A map with semi-transparent circular overlay can be helpful in analysis.

