 VAST Challenge 2018 MC2: Like a Duck to Water
Conclusion
Question1
Characterize the past and most recent situation with respect to chemical contamination in the Boonsong Lekagul waterways. Do you see any trends of possible interest in this investigation? Your submission for this questions should contain no more than 10 images and 1000 words.
| Measure |
Details |
| Water Temperature
|
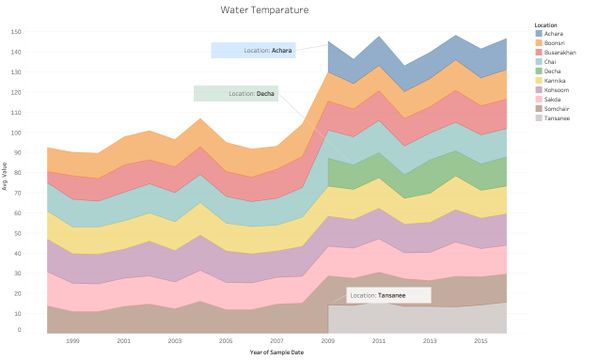
The water temperature trends are looks similar among the 10 locations. And all of them have quite same up and down trend among these years. Even though 3 of the locations which are Achara, Decha, Tansanee are only be recorded from 2009, they still have the same trend with others. In additional, the whole trend of the water temperature in 10 locations are increasing over the 15 years.

|
| Macrozoobenthos
|
Now the records of Macrozoobenthos are not continuously as they were before, Busarakhan and Somchair did not record since 2008.
The values of Macrozoobenthos are not change too much from 1998 to 2013, but in 2014 it suddenly increased to 36 in Kannika and 37 in Sakda , then the values came back to around 2 in the next year. Since the higher value of Macrozoobenthos may indicate the better water quality, we may have a guess that the water quality had a improvement in 2014 at this two location.
 |
| Chemical Contaminant
|
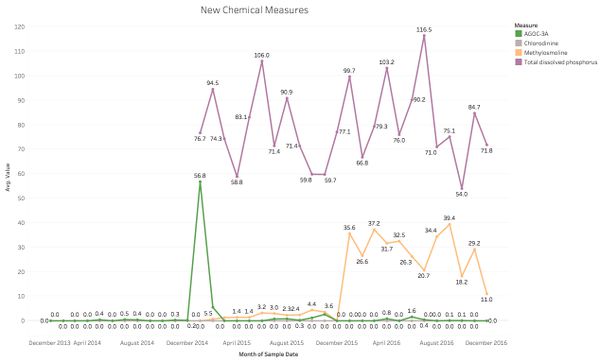
When we visual the data, we found that there are 4 measures only be recorded in recent years. And this may caused by the change of the water quality.
As a whole, we can see that the Total dissolved phosphorus has the highest value compare to the other 3 measures in the three years, and this one has the most changeable trend. AGOC-3A and Chlorodinine have low and steady values except AGOC-3A suddenly increased sharp in Dec 2014.

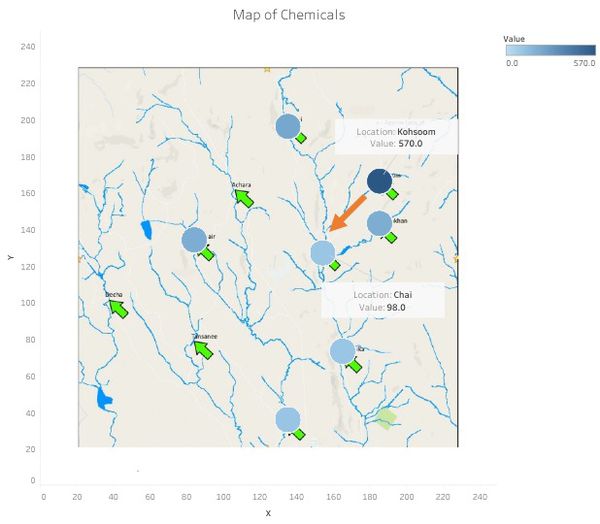
Through the map, we can see that the Kohsoom has the highest value of new chemicals and the Chai' has the lowest value. Also the river route should be Kohsoom to Chai.

|
Question2
What anomalies do you find in the waterway samples dataset? How do these affect your analysis of potential problems to the environment? Is the Hydrology Department collecting sufficient data to understand the comprehensive situation across the Preserve? What changes would you propose to make in the sampling approach to best understand the situation? Your submission for this question should contain no more than 6 images and 500 words.
Question3
After reviewing the data, do any of your findings cause particular concern for the Pipit or other wildlife? Would you suggest any changes in the sampling strategy to better understand the waterways situation in the Preserve? Your submission for this question should contain no more than 6 images and 500 words.
Reference


