ISSS608 2017-18 T3 Assign Gao Jiaoyang Data Preparation
|
|
|
|
|
Contents
Data Description
Data Souce
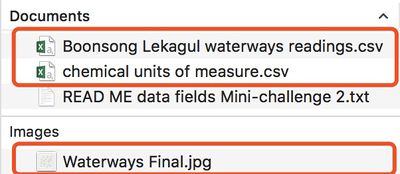
The original data is offered by the website, and the main data I use for this assignment includes 2 documents and 1 image as show as below.
Data Overview
Boonsong Lekagul waterways readings.csv
This file includes all the records for Boonsong Lekagul waterways by 5 columns with 136,824 observations.
| Column | Overview |
|---|---|
| ID | Unique ID for each observation. |
| Value | Measured value for the chemical or property in this record. |
| Location | Name of the location sample was taken from which include 10 sites in total. |
| Sample date | Date sample was taken from the location, and the data was recorded for 1,965 days from 11/01/1998 to 31/12/2016. |
| Measure | Chemicals or water properties measured in the record which includes 106 different types. |
chemical units of measure.csv
This file explains the unit for each measure tested for the research, and includes 106 measures and 4 kinds of unit which are C for water temperature, blank for Macrozoobenthos and mg/L, µg/L for rest of the measures . May need to unify these units before move to further analysis.
| Measure | Unit |
|---|---|
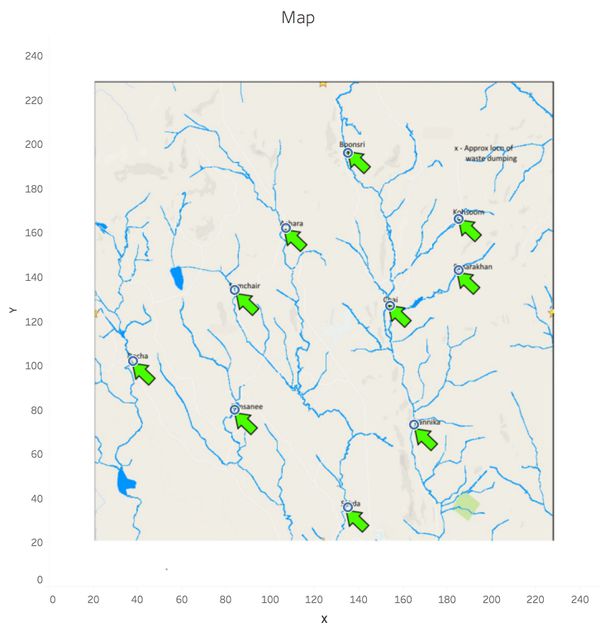
Waterways Final.jpg
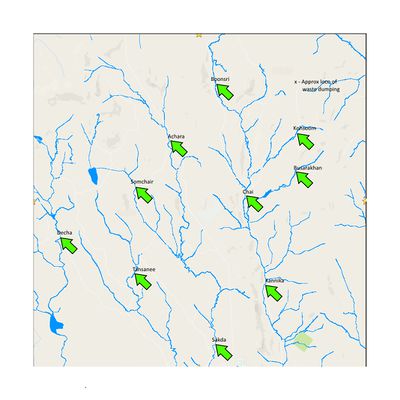
The map shows the geographic position of the location samples, and how they connected with each other through river.
Data Preparation
Data Standardization
The data are recorded by different units, this may make analysis result deviate. So we need to uniform the units before moving to next stage. This progress could be easily done in JMP.
Firstly, join the two tables by matching the measure.
Then write a parallel conditional function to transform the mg/L value to µg/L.
Now, the data includes 3 kinds of units which are C for water temperature, blank for Macrozoobenthos, and µg/L for the rest of measures.
Remove Duplications
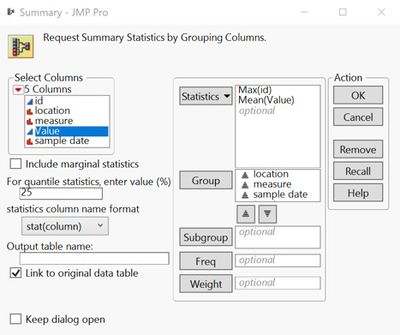
When look at the raw data, I found that there are multiple records for the same measure in the same date at the same location. In order to avoid the duplications, I decided to only keep the max id and calculate the mean value as final value. Then the raw data only remain 67,503 observations.
Missing Value
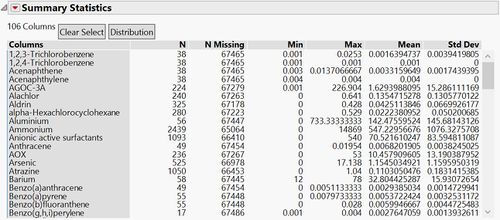
It would be easier to us to view missing values after transfrom measures into column. This could be easily done in JMP. After split raw dataset by measure, the dataset includes 109 columns with 106 measures and 67,503 observations.
And through column viewer, we can see there is a lot of missing value shown in this table, which means the sample measure and sample date are not regularly.
Mapping Location
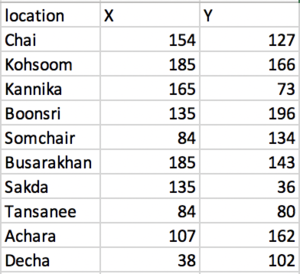
Need to map the locations in the waterways map with coordinates.
