ISSS608 2017-18 T3 Assign Vaishnavi Praveen Agarwal DataPrep
|
|
|
|
|
|
|
Data Description
|
File Name |
Variables |
|
Boonsong Lekagul waterways readings (.csv file) |
The given data file has reading of 106 chemicals at 10 different locations from 1998 - 2016. i. id (numeric , unique)
|
|
chemical units of measure (.csv file) |
The given data file has the unit of each measure (106 measures) in which the readings were taken. i. measure (string, unique)
|
|
Waterways Final (.jpg file) |
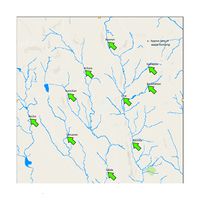
The Waterways Final is a map image that shows the location of dumping site and the waterways. |
Data Preparation
1. Grouping Measure
There are a total of 106 measures given in the data file, and it is difficult to view all the measures at a glace. In order to make the visualization simple I have grouped the measure based on their Chemical Composition and Behavior.
- A new column was added in the file chemical units of measure.csv
- Name the column as groups
- Chemical properties of each measure was studied and they were divided in 12 groups.
- Manually assigned the relevant group to each measure.
The 12 groups formed are:
- Field measurements
- Heavy metals
- Hydrocarbon
- Insecticides, Pesticides and Herbicides
- Metal
- Mineral and Nutrients
- Nitrogen
- Organic
- Others
- Oxygen
- Salt
- Water temperature

