From Visual Analytics and Applications
Jump to navigation
Jump to search
 VAST 2018 Mini Case 3: Net of Justice Has Long Arms
Company Overview
| Findings |
Visualization Evidence |
| Overall Patterns
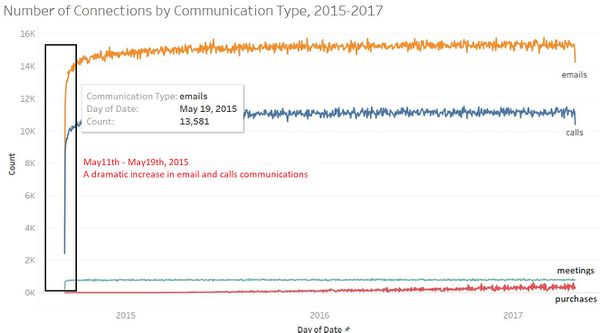
- Company Growth: The overall trend in communications has been relatively flat over the years. This implies that there hasn't been much expansions in Kasios, otherwise, more interactions will be presented.
- Dramatic Changes: Emails and calls communications has gone up by 14% from May 11th to May 19th, 2015. It can be partically explained by the fact that data for May 11th 2015 was only captured after 15:00, and thus data wasn't complete. However, that doesn't explain shortages in communication from May 12th to May 19th.
- Method of Communication: It’s also obvious that people in Kasios favours emails than calls, and they least favour meetings in terms of communications.
- Purchases: Apparently not everyone in the company has involvement in purchases, that’s why there is only very little amount of purchases communication.
|
|
| Break down by Months
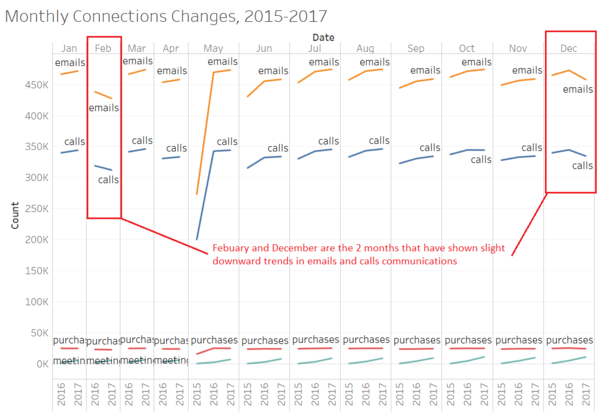
- Febuary & December: All communications has been increasing over the past 3 years, except for Febuary and Decemeber. This may require further researches.
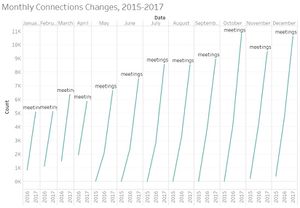
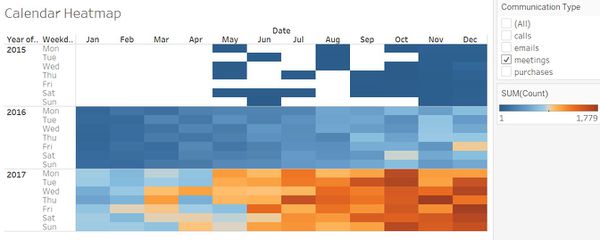
- Meetings: the number of meetings has been increasing drastically throughout the years. This is implying that people in Kasios are gradually shifting toward face-to-face communications.
A more interesting question could be: what's causing the face-to-face shift since there is not much expansion in Kasios.
|
|
| Break down by Weeks
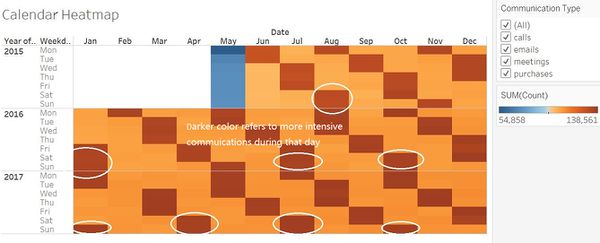
- Weekdays & Weekdays: Surprisingly, there are interactions during the weekends than in the weekdays for particular months. We can also tell from the graph that workloads are not always evenly distributed over the week.
- Meetings: As what has been discussed earlier, the number of meetings has been increasing visibly from 2015 to 2017. Especially in June, July and August of 2015, there are many days without a single meeting. And in the last quater of 2017, staffs are heavy burdened in meetings whether it's weekdays or weekends.
|
|
Suspicious Records Exploration
| Findings |
Visualization Evidence |
| Suspicious Communications
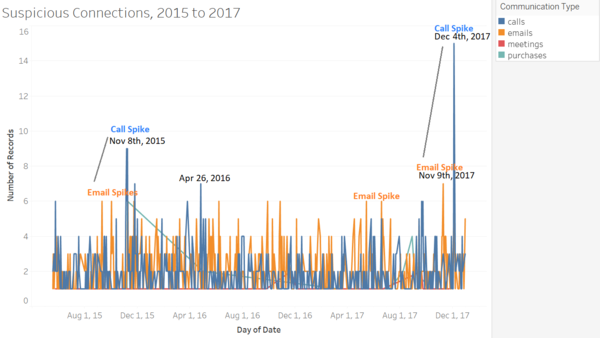
- Calls & Emails: Suspicious emails and calls spkies seem to follow one another. Normally, there will be a emails spikes then followed by calls spikes.
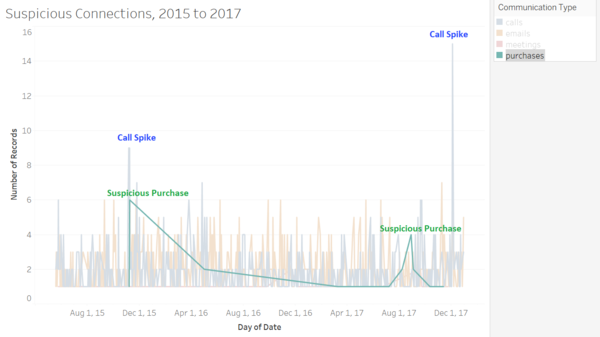
- Suspicious Purchases: Suspicious purchases may be key to the puzzle. As we can see, suspicious purchases are more or less follow the suspicious calls spikes.
|
|
| Suspicious Network Overview
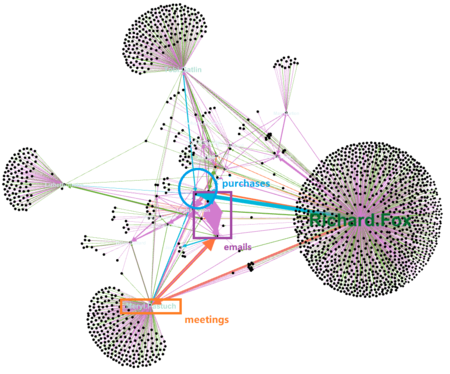
The overview graph is plotted by everyone who is in the suspicious connection list whether it's the sender or receiver. For a directed graph, the person who was pointed by the arrow is the receiver. The number of connections is represented by thickness of the edge.
- Groups: There are couple of isolated groups that are connected by a single person, yet most of the connections are one-time connection and no replies. People in the isolated groups of the graph may be copied or notified with an email that doesn't require any reply.
- Center of the Graph: As we approach the center of the graph, more actual interactions have shown. Lots of suspicious emails have went around 2 person. Suspicious meetings are either pointed from or towars the same person - Meryl Pastuch. Most importantly, all suspicious purchases are pointed toward the same person. And all the nodes in the center are connected in a way.
|
|
|

