AssignYL Explore

From Visual Analytics and Applications
Jump to navigation Jump to search

YL title bg.jpg VAST 2018 Mini Case 3: Net of Justice Has Long Arms


BACKGROUND

DATA PREPARATION

EXPLORATIONS

NETWORK ANALYSIS

CONCLUSIONS

Company Overview

Findings Visualization Evidence
Overall Patterns


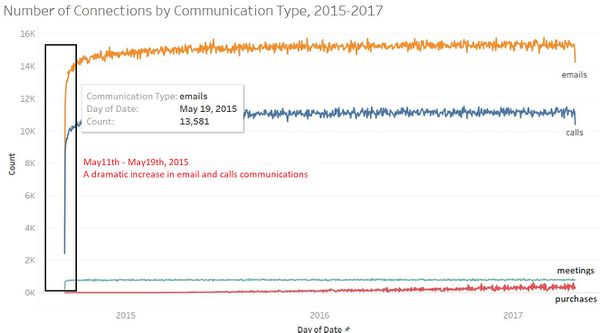
  • Company Growth: The overall trend in communications has been relatively flat over the years. This implies that there hasn't been much expansions in Kasios, otherwise, more interactions will be presented.
  • Dramatic Changes: Emails and calls communications has gone up by 14% from May 11th to May 19th, 2015. It can be partically explained by the fact that data for May 11th 2015 was only captured after 15:00, and thus data wasn't complete. However, that doesn't explain shortages in communication from May 12th to May 19th.
  • Method of Communication: It’s also obvious that people in Kasios favours emails than calls, and they least favour meetings in terms of communications.
  • Purchases: Apparently not everyone in the company has involvement in purchases, that’s why there is only very little amount of purchases communication.
YL Tblu 1.JPG
Break down by Months


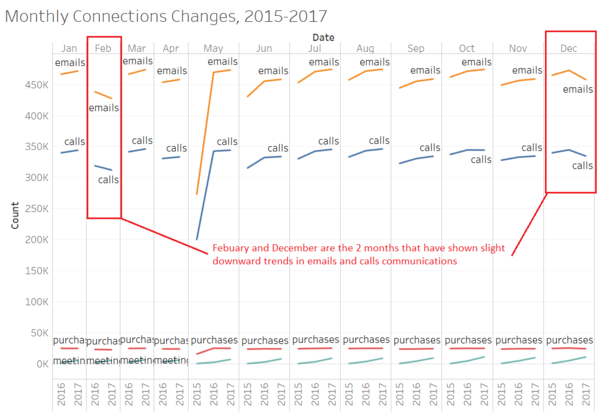
  • Febuary & December: All communications has been increasing over the past 3 years, except for Febuary and Decemeber. This may require further researches.
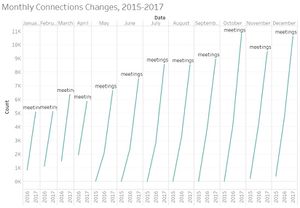
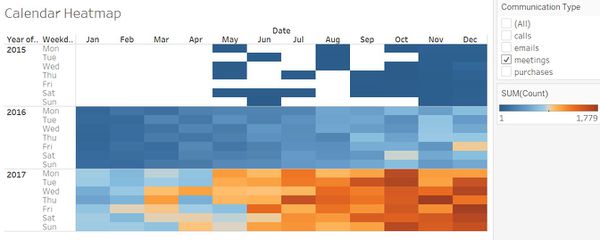
  • Meetings: the number of meetings has been increasing drastically throughout the years. This is implying that people in Kasios are gradually shifting toward face-to-face communications.

A more interesting question could be: what's causing the face-to-face shift since there is not much expansion in Kasios.


YL Tblu 2.JPG
YL Tblu 3.JPG
Break down by Weeks


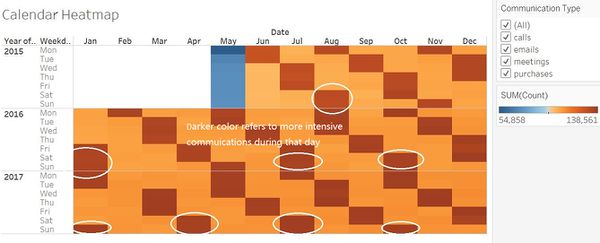
  • Weekdays & Weekdays: Surprisingly, there are interactions during the weekends than in the weekdays for particular months. We can also tell from the graph that workloads are not always evenly distributed over the week.
  • Meetings: As what has been discussed earlier, the number of meetings has been increasing visibly from 2015 to 2017. Especially in June, July and August of 2015, there are many days without a single meeting. And in the last quater of 2017, staffs are heavy burdened in meetings whether it's weekdays or weekends.
YL Tblu 4.JPG
YL Tblu 5.JPG


Suspicious Records Exploration


Findings Visualization Evidence
Suspicious Communications


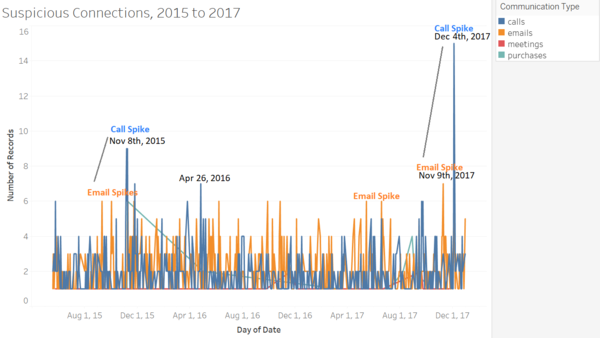
  • Calls & Emails: Suspicious emails and calls spkies seem to follow one another. Normally, there will be a emails spikes then followed by calls spikes.
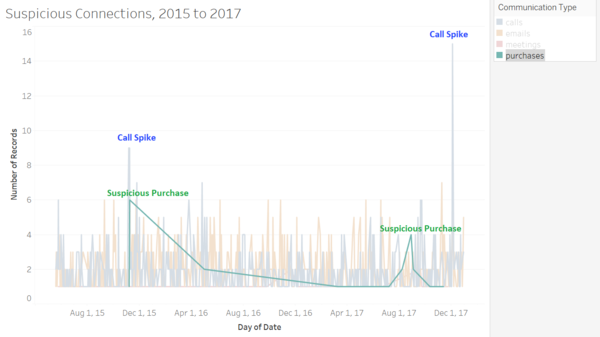
  • Suspicious Purchases: Suspicious purchases may be key to the puzzle. As we can see, suspicious purchases are more or less follow the suspicious calls spikes.
YL Tblu 6.PNG
YL Tblu 7.PNG
Suspicious Network Overview


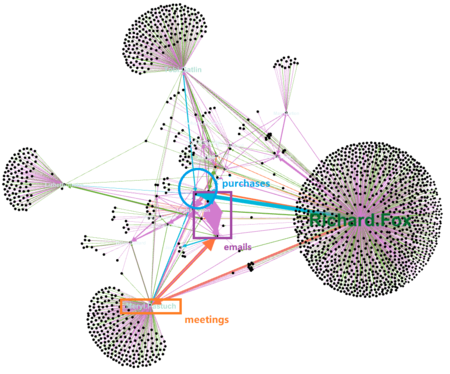
The overview graph is plotted by everyone who is in the suspicious connection list whether it's the sender or receiver. For a directed graph, the person who was pointed by the arrow is the receiver. The number of connections is represented by thickness of the edge.

  • Groups: There are couple of isolated groups that are connected by a single person, yet most of the connections are one-time connection and no replies. People in the isolated groups of the graph may be copied or notified with an email that doesn't require any reply.
  • Center of the Graph: As we approach the center of the graph, more actual interactions have shown. Lots of suspicious emails have went around 2 person. Suspicious meetings are either pointed from or towars the same person - Meryl Pastuch. Most importantly, all suspicious purchases are pointed toward the same person. And all the nodes in the center are connected in a way.
YL NW 1.PNG