 VAST Challenge 2018 Mini-Challenge 2:Like a Duck to Water
Preliminary Analysis
Q1: Characterize the past and most recent situation with respect to chemical contamination in the Boonsong Lekagul waterways. Do you see any trends of possible interest in this investigation?
| Analysis |
Visualization |
|---|
| 1. Inconsistent Sampling among Measures”
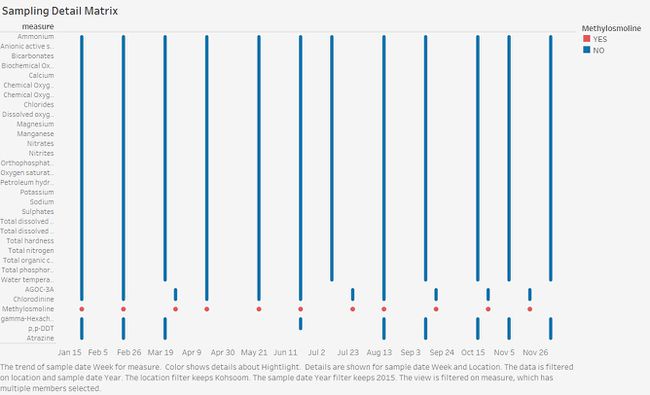
By lining up all the measures for each location at certain period time, we could see the sampling missing pattern for from several dimension. In the sampling detail matrix, one line indicates a single week, horizontally we could see how frequently a measure is recorded in a year and compare the measures sampling time, vertically we could find the measures are recorded within a particular week.
From the example below, which shows records of location Kohsoom in year 2015, we could see that contaminants AGOC-3A, Chlorodinine, Methylosmoline are always sampled in a different time as other measures, depicting a discrepancy among other measures but maintain similar interval. Thus, these three measures remain further exploration for correlation or practical interaction.
|
|
| 2. Measures with Same Sampling Pattern”
Mentioned by scholar that Methylosmoline is the confirmed contaminant in the waste from light manufacture, so we start with this measure to explore more related changes. From the record frequency gantt chart, we could see the irregular sampling interval through all the years and locations, in some years, many records are noted down whereas there are frequent wide gap appeared between two sampling date in other years. Regarding to Methylosmoline, location Achara, Decha, Tansanee do not take such sample, for those sampled location, this chemical had only been measured from year 2014 onwards. Interestingly, early mentioned suspect correlated measures Chlorodinine, AGOC-3A show identical record frequency patterns as Methylosmoline, meaning that these three chemicals are sampled together under certain condition.
|
|
| 3.Methylosmoline Overall Trend
We now focus on contaminant Methylosmoline to view the pollutant situation across all the sampled location by year. Overall, at the start of sampling, there are indifferent concentration in Methylomsmoline for all the location, which could view as a normal status without dumping from the manufacture.
Right from end of year 2014, different streams began to show diverging trend with a rocket increasing concentration in Somchair, Kohsoom, Chai, while other location remains the same level as previous time. Those sites with stable trend all experienced a sharp dropdown at the end of year 2015, and all drop to around 0.02 mg/L of Methylosmoline, since they are in the same stream system, the most reasonable reason caused drops is the environment. In terms of the macro impact from environment, there should be more or less impact to other stream regardless of the location, since impacted stream have no hierarchical networks among each other. Thus Somchair, Kohsoom and Chai are the most suspect candidate dumping sites, and more justification from other measures and pattern analysis need to be done to investigate deeper.
|
|


