ISSS608 2017-18 T3 Assign Hu Yunxia
Revision as of 18:51, 8 July 2018 by Yunxia.hu.2017 (talk | contribs) (→ISS608_2017-18_T3_G2_Assign_Hu Yunxia)
Contents
Vast Challenge 2018 : Minicase 2
Background
Data Preperation
Modifications on Source Data Table
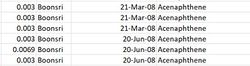
- At same location and in same date, there was three measured value with the same measurement like the below figure. It indicated that there were three samples taken to measure to make sure more precious value of measurement. So, calculating mean to represent each measure at one location and in any month.

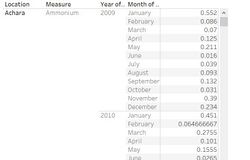
- In tableau, drag location, measure, sample date into rows respectively -> Dill down sample date into month level and exclude quarter level-> drag value into text area and change measure into average as the below figure shows. After that, export table and save it as new Boonsong Lekagul waterways readings to apply another analysis.

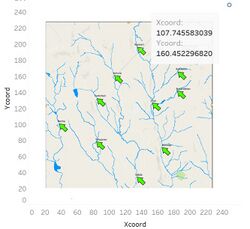
- Create a new excel file to record the coordinates of location on given map. Set one column for location name and fill it with ten location and two empty columns for recording x-coordinate and y-coordinate respectively. In addition, set an additional row for max value of x and y as 249.
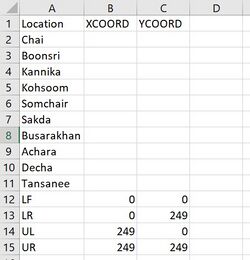

- In tableau, add background image as map. Then, annotate point to get the value as x-coordinate and y-coordinate.

Data Import
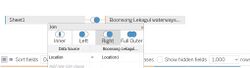
- Table Join
Open tableau -> import file new Boonsong Lekagul waterways readings -> add new data source, join location sheet with it, right join with Location.

Insights
Question 1
Characterize the past and most recent situation with respect to chemical contamination in the Boonsong Lekagul waterways. Do you see any trends of possible interest in this investigation?
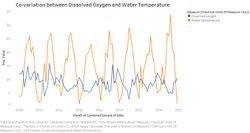
- Dissolved Oxygen and Water Temperature among ten measured locations display cyclical pattern within sample date as the Figure 1.1 and Figure 1.2 show. What’s more, when plotting them together, it’s obvious to indicate that there is co-variation between Dissolved Oxygen and Water Temperature as the Figure 1.3 shows.
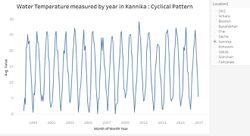

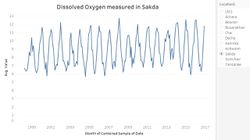


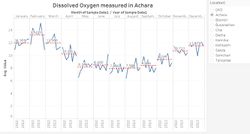
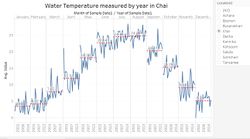
- In addition, to plot cyclical line graph of Dissolved Oxygen and Water Temperature for further analysis as the Figure 1.4 and Figure 1.5 show. It demonstrates that in summer, water temperature would be higher than other seasons among ten locations. On the other hand, in summer, Dissolved Oxygen would be lower than other seasons among ten locations.


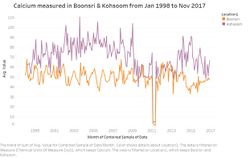
- Furthermore, in terms of Calcium, there is obvious co-variation between in Boonsri and in Kohsoom as the Figure 1.6 shows. In other words, when measured value of Calcium was high in Kohsoom, it appeared the opposite trend in Boonsri. Beyond that, after Jan 2011, the volume of Calcium dropped radically in both locations and had kept the lowest value until May 2011. It might be a clue to make up for soil evidence.

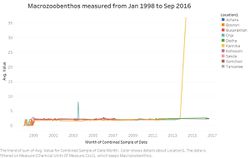
- In terms of Macrozoobenthos, there was identical trend in Kannika and in Sakda. To be specific, from Oct 2013, the number of Macrozoobenthos increased rapidly and reached highest point at May, 2014 as the below Figure 1.7 shows. Furthermore, the similar trend of rest chemical measurements also happened between in Kannika and in Sakda.

Question 2
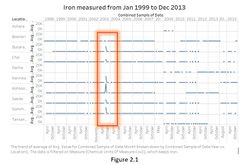
- According to a global review of national regulations and standards for drinking-water quality from World Health Organization, per litre water could include maximum 2mg iron. However, there was unusual spike happening in Aug 2003 at Busarakhan, Chai, Kannika, Kohsoom, Sakda and Somchair, which was far high than 2mg as the Figure 2.1 shows.

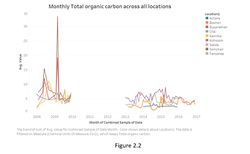
- The Figure 2.2 displays the records in Boonsong Lekagul waterways readings.csv. It captures the Total organic carbon in different locations during measured periods. However, there was a gap between 2010 and 2013. Specifically, before 2010, only displayed the trend of total organic carbon in Busarakhan, Chai, Sakda, Kannika and Somchair and after 2013, displayed the rest of locations as the Figure 2.2 shows. It may have an effect on to compare this measure among all locations.