ISSS608 2017-18 T3 Assign Hu Yunxia
Vast Challenge 2018 : Minicase 2
Contents
Background
Last year, the Kasios Furniture Company was implicated in environmental damage to the Boonsong Lekagul Wildlife Preserve for both dumping toxic waste and polluting the air with chemicals from its manufacturing process. But Kasios is not taking these accusations lying down, and they deny any accusation of industrial waste dumping! Kasios’ spokespersons state that there isn’t any ground contamination near the remote ranger station that was suggested by last year’s mini-challenge 1 and 3 participants, and they have inspected that area and found it as pristine as the rest of the preserve.
Outraged ornithology professors from Mistford College journeyed out to look over the dumping site themselves and perform soil analyses. They returned to report that the site looked like there had been recent excavation and building activities going on. Boonsong Preserve rangers later confirmed that a new ranger station was being built at that site! Soil samples taken from the site were inconclusive in detecting Methylosmolene (the toxic manufacturing chemical in the suspected dumping) or any other contaminant, as new top soil had been trucked in.
With a primary piece of evidence against Kasios now gone, investigators will need to take another approach. Professors in the Mistford College Hydrology Department have come forward with several years of water sensor readings from rivers and streams in the preserve. These samples were taken from different locations scattered throughout the area and contain measurements of several chemicals of possible interest, but they have never been analyzed due to lack of funding. Could visual analytics help reveal something in this data that could make up for the soil evidence that was destroyed?
Data Preperation
Modifications on Source Data Table
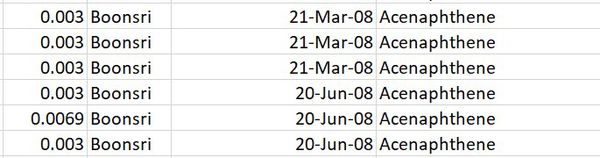
- At same location and in same date, there was three measured value with the same measurement like the below figure. It indicated that there were three samples taken to measure to make sure more precious value of measurement. So, calculating mean to represent each measure at one location and in any month.

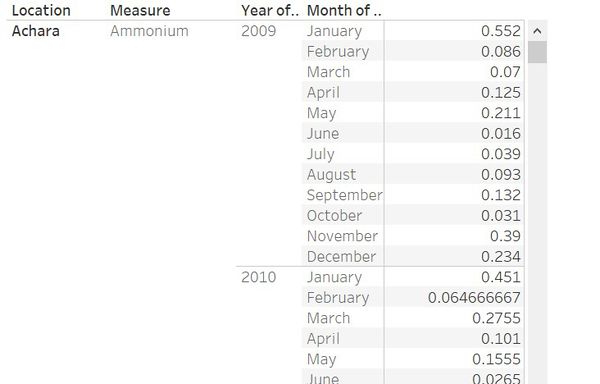
- In tableau, drag location, measure, sample date into rows respectively -> Dill down sample date into month level and exclude quarter level-> drag value into text area and change measure into average as the below figure shows. After that, export table and save it as new Boonsong Lekagul waterways readings to apply another analysis.

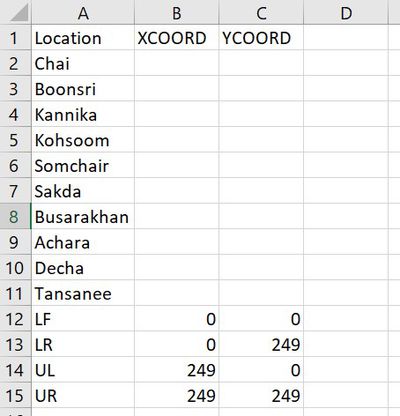
- Create a new excel file to record the coordinates of location on given map. Set one column for location name and fill it with ten location and two empty columns for recording x-coordinate and y-coordinate respectively. In addition, set an additional row for max value of x and y as 249.

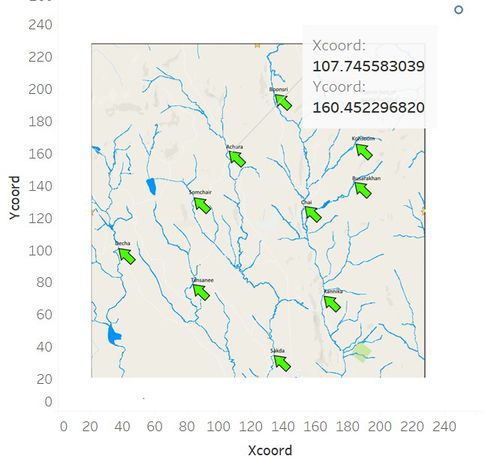
- In tableau, add background image as map. Then, annotate point to get the value as x-coordinate and y-coordinate.

Data Import
- Table Join
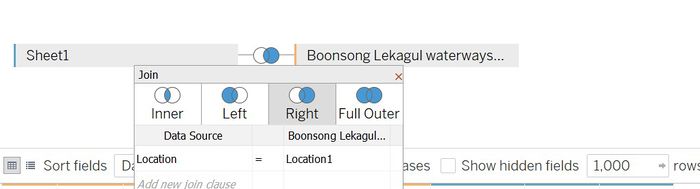
- Open tableau -> import file new Boonsong Lekagul waterways readings -> add new data source, join location sheet with it, right join with Location.

Insights
Question 1
Characterize the past and most recent situation with respect to chemical contamination in the Boonsong Lekagul waterways. Do you see any trends of possible interest in this investigation?
- Dissolved Oxygen and Water Temperature among ten measured locations display cyclical pattern within sample date as the Figure 1.1 and Figure 1.2 show. What’s more, when plotting them together, it’s obvious to indicate that there is co-variation between Dissolved Oxygen and Water Temperature as the Figure 1.3 shows.
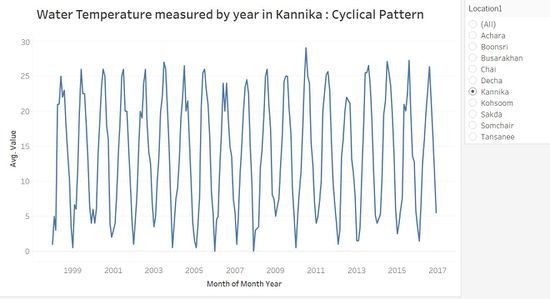
                             Figure 1.1                                                                       Figure 1.2


                                                                      Figure 1.3


- In addition, to plot cyclical line graph of Dissolved Oxygen and Water Temperature for further analysis as the Figure 1.4 and Figure 1.5 show. It demonstrates that in summer, water temperature would be higher than other seasons among ten locations. On the other hand, in summer, Dissolved Oxygen would be lower than other seasons among ten locations.
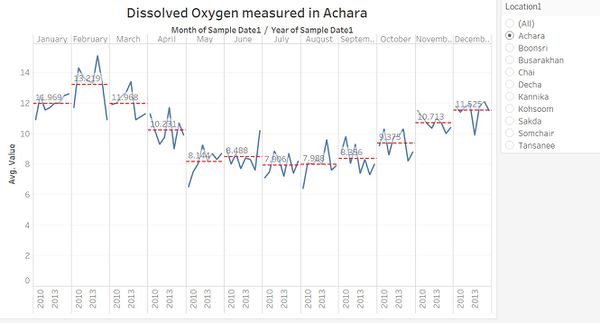
Figure 1.4 Figure 1.5


- Furthermore, in terms of Calcium, there is obvious co-variation between in Boonsri and in Kohsoom as the Figure 1.6 shows. In other words, when measured value of Calcium was high in Kohsoom, it appeared the opposite trend in Boonsri. Beyond that, after Jan 2011, the volume of Calcium dropped radically in both locations and had kept the lowest value until May 2011. It might be a clue to make up for soil evidence.
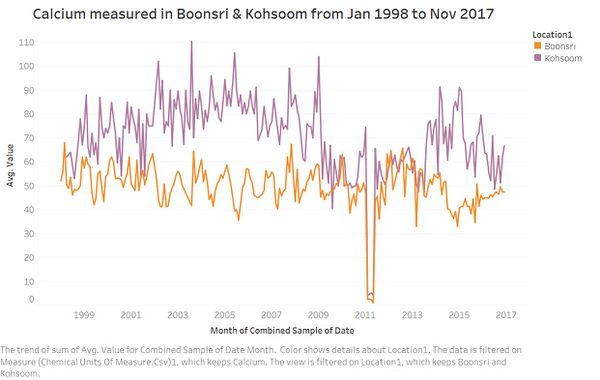 Figure 1.6

- In terms of Macrozoobenthos, there was identical trend in Kannika and in Sakda. To be specific, from Oct 2013, the number of Macrozoobenthos increased rapidly and reached highest point at May, 2014 as the below Figure 1.7 shows. Furthermore, the similar trend of rest chemical measurements also happened between in Kannika and in Sakda.
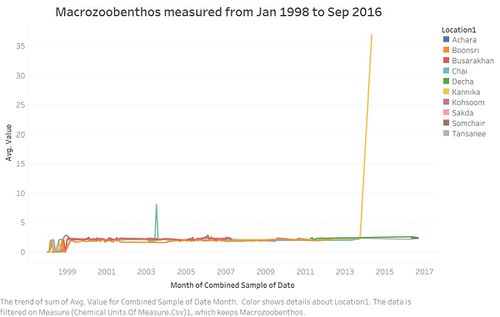 Figure 1.7

Question 2
What anomalies do you find in the waterway samples dataset? How do these affect your analysis of potential problems to the environment? Is the Hydrology Department collecting sufficient data to understand the comprehensive situation across the Preserve? What changes would you propose to make in the sampling approach to best understand the situation?
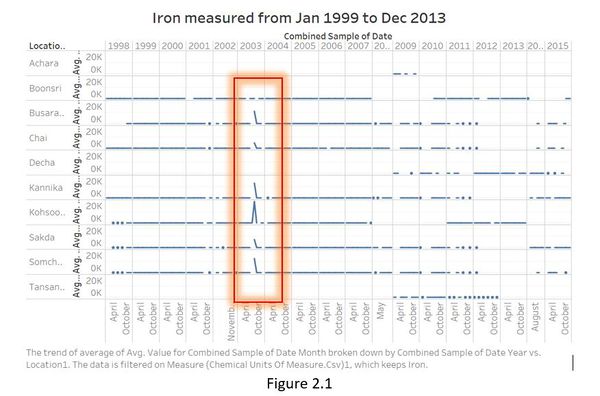
- According to a global review of national regulations and standards for drinking-water quality from World Health Organization, per litre water could include maximum 2mg iron. However, there was unusual spike happening in Aug 2003 at Busarakhan, Chai, Kannika, Kohsoom, Sakda and Somchair, which was far high than 2mg as the Figure 2.1 shows.

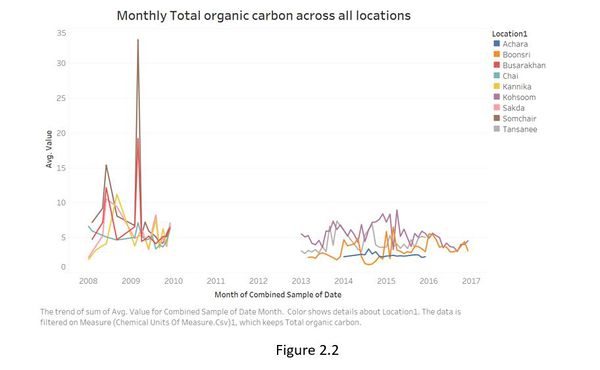
- The Figure 2.2 displays the records in Boonsong Lekagul waterways readings.csv. It captures the Total organic carbon in different locations during measured periods. However, there was a gap between 2010 and 2013. Specifically, before 2010, only displayed the trend of total organic carbon in Busarakhan, Chai, Sakda, Kannika and Somchair and after 2013, displayed the rest of locations as the Figure 2.2 shows. It may have an effect on to compare this measure among all locations.

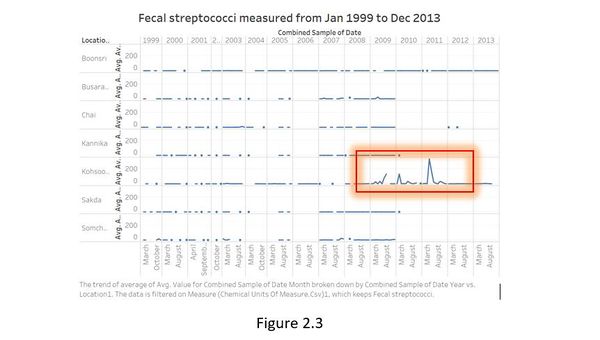
- In Kohsoom, the content of Fecal Streptococci has fluctuated obviously after Feb 2009, which far exceeded in other locations and had three spikes as the Figure 2.3 shows. However, in other locations, there was no such abnormal phenomenon.

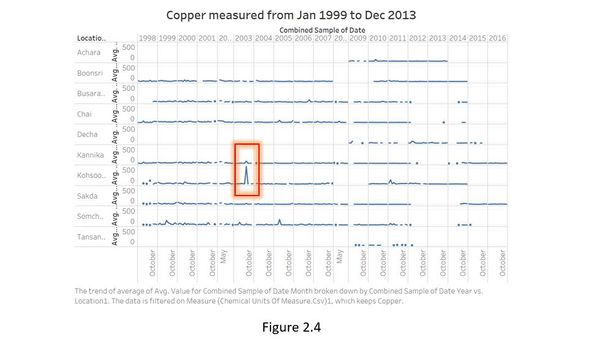
- As for copper, it also appeared unusual trend in Kohsoom. Although the content of copper has fluctuated from Jan 1999 to Nov 2017 in all measured locations, in Kohsoom it has spike with far highest value among all locations as the Figure 2.4 shows.

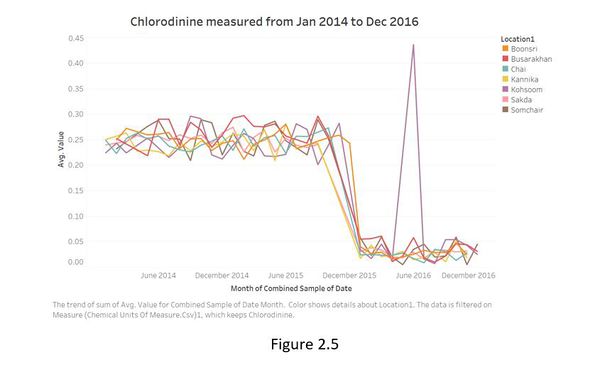
- Furthermore, in Kohsoom, the content of chiorodinine also appeared exceptional spike during April to Aug of 2016. In addition, it demonstrated unexpected decline around Oct 2015 for all locations as the Figure 2.5 shows.

- In addition, the time interval was not same for different measurements, even not continuous in some measures. It’s difficult to compare different measures in different locations. Within below abnormal data, it would mislead us to analyse potential problems in the Boonsong Lekagul waterways. For some measures such as Chrysene, only collected two-years data and some measures missed several months during whole period. So, in order to understand better for this case, it’s necessary for investigator to collect more data in these measures and try to record it in same interval. So, I suggest that set a fixed time interval to taking water sample in different locations.
Question 3
After reviewing the data, do any of your findings cause particular concern for the Pipit or other wildlife? Would you suggest any changes in the sampling strategy to better understand the waterways situation in the Preserve?
- The Figure 3.1 and Figure 3.2 displays parallel coordinates plot of each measure in each location. It captures the changes of each measure in different locations. In terms of locations, most measures have similar changes in Somchair, Busarakhan, Boonsri and Kohsoom, which demonstrates that these sampling points illustrates similar potential problems. So, Achara and Decha could be in one group named as group 2. Chai and Sakda could be in group 3.
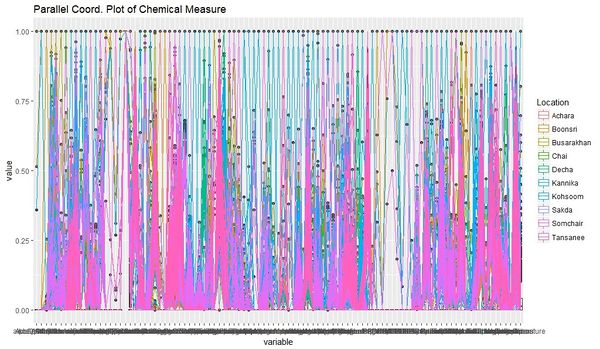
Figure 3.1 Figure 3.2


- From the map of ten sampling location as the Figure 3.3 shows and combine the below observations, for group 1, Kohsoom is near by Busarakhan so that we could combine these two points into one sampling point. For the other groups, the distance between the sampling points is not close to optimize.
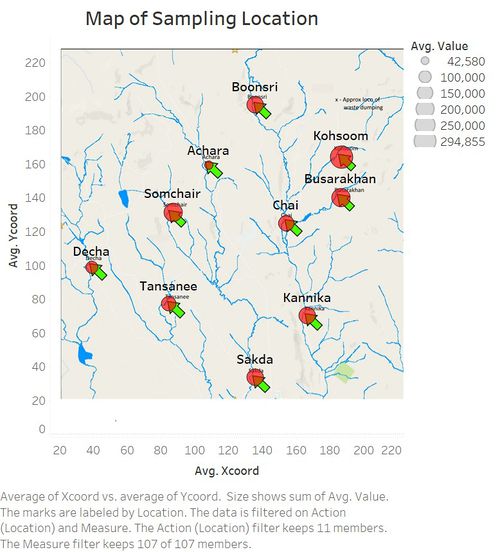 Figure 3.3
