ISSS608 2017-18 T3 Assign Vishal Badrinarayanan Data Preparation
|
|
|
|
|
|
|
|
|
Contents
Dataset List
|
TABLE NAME |
SIZE |
|
CALLS |
10.6 million calls |
|
EMAILS |
14.6 million Emails |
|
PURCHASES |
762000 Purchase |
|
MEETINGS |
127000 Meetings |
|
OTHER SUSPICIOUS PURCHASES |
7 Purchase |
|
SUSPICIOUS CALLS |
71 Calls |
|
SUSPICIOUS EMAILS |
61 Emails |
|
SUSPICIOUS MEETINGS |
5 Meetings |
|
SUSPICIOUS PURCHASES |
1 Purchase |
|
COMPANY INDEX |
642,631 Employee Records |
Dataset Description:
The datasets Calls, Emails ,Purchases ,Meetings , Other Suspicious Purchases , Suspicious Calls , Suspicious Emails , Suspicious Meetings , Suspicious Purchases have the same data format.
|
Column Name |
Description |
|
Source |
Source for the communication |
|
E-Type |
Type of communication . They are divided into 4 categories: 1. Calls designated as 0 2. E-mails designated as 1 3. Purchases designated as 2 4. Meetings designated as 3 |
|
Target |
Target of the Communication |
|
Timestamp |
Time of communication |
The company Index dataset has details about the employees:
|
Column Name |
Description |
|
ID |
ID of the employee |
|
First Name |
First Name of the Employee |
|
Last Name |
Last Name of the Employee |
|
Data Preparation Step |
Description |
|
Combine the email , call , meeting and purchase dataset |
The Data Preparation has been done in Tableau and R.Initially we are provided with 10 Datasets. Our aim is to get all the dataset in a similar format so that it can be used for multiple functions and visualizations.
Since we cannot manually combine all the datasets using any commercial on the shelf software like jmp , Tableau due to time constraint we use R to merge all the dataset. To merge datasets we need to ensure they have the same column names. So the first step is to load the data and provide the column names as "Source","Etype","Target","Timestamp".
The datasets calls , emails,meetings ,purchases are merged together as total_data.The combined size is 26046478 rows and 4 variables. |
|
Combine Suspicious calls , emails , meeting , purchase dataset |
The datasets Suspicious calls,Suspicious Emails,Suspicious Purchases,Other Suspicious purchases are merged together. But before that the column names for these tables need to be assigned and then merged by rows using rbind. The combined size is 137 observations and 4 variables. |
|
Filter Total Dataset using aggregated suspicious list. |
Since we have an aggregated suspicious data table we extract the nodes from source and target. After getting a list we filter the total_data using this suspicious list of nodes where we filter any row whose source or target will have a value from the list. We get 2035 observations and 5 variables.
total[total$Source %in% susp_list | total$Target %in% susp_list,] |
|
Adjust Time Format |
Next the time format of the timestamp needs to be altered to be used in GEPHI. WE convert it from '%d-%m-%Y %H:%M:%S' to "%Y/%m/%d %H:%M:%S" for all the above derived datasets. |
|
Company Index Data Preparation |
Based on the 20 people list we got as suspects we need to create a field called Suspect_List with values ‘Yes’ or ‘No’ which are matched with the ID’s in the company index data.
Also we need to filter the company index table based on the combined suspicious list. |
Tableau Data Preparation Step
|
Data Preparation |
Description |
|
Calculate Field – Time of the Day |
Which groups timestamp to 4 categories: 1. Early Morning 2. Morning 3. Evening 4. Night |
|
Calculated Field – E_Type Value |
Gives E_Type values as: 1. 0 – Calls 2. 1 – Emails 3. 2 – Purchases 4. 4 - Meetings |
|
Calculated Field – Max Date |
Calculates Max value of Date by Source |
|
Calculate Field – Min Date |
Calculates Min value of Date by Source |
|
Calculate Field - Tenure |
Calculates tenure which is Max Date – Min Date |
|
Calculated Filed - Emp_Status |
Calculates if employee is ‘Active’ or ‘Terminated’ based on Timestamp value and Max Date. |
|
Calculated Field- Source Target Combination |
Concatenate Source and Target |
Gephi Data Preparation Step
|
Data Preparation |
Description |
Images |
|
Node List |
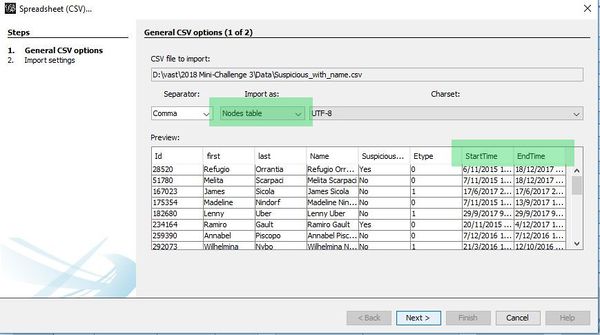
We need to use the filtered Company Index table. Also we need to get the max and min date values from the data table we used for tableau which can be used as ‘Start Date’ and ‘End Date’ for an observation. |
|
|
Edge List |
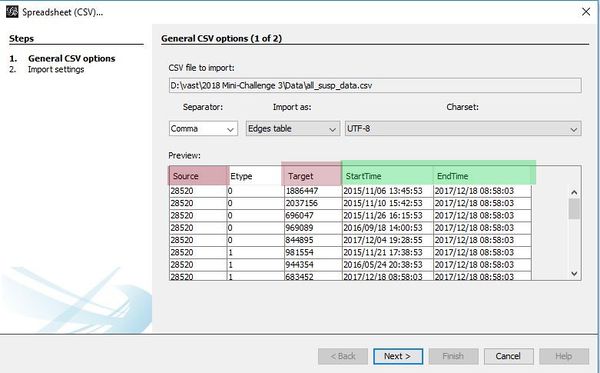
We can use the Filtered Total Dataset(used in tableau data prepartion) based on the suspicious list for our edge table as they have a ‘Source’ and ‘Target’ field which gephi takes as input for an edge. Also we would have ‘Start Date’ and ‘End Date’ based on the source .
The ‘Start Date’ and ‘End Date’ field can be used for Dynamic Network graph in gephi. |
|
|
Import Dataset with appropriate Format selection. |
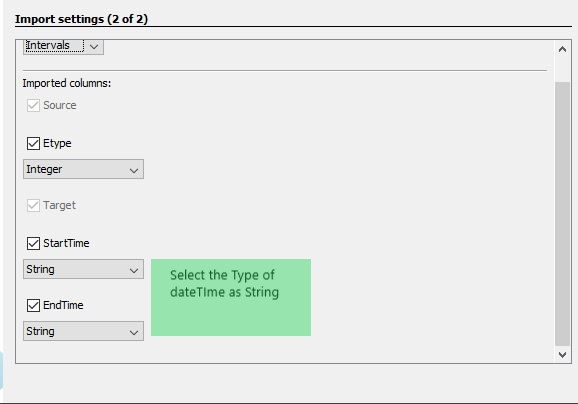
There has to be columns named ‘Source’ and ‘Target’. When importing the date has to be set in String format in Gephi.
|
|
|
Aggregate Selection |
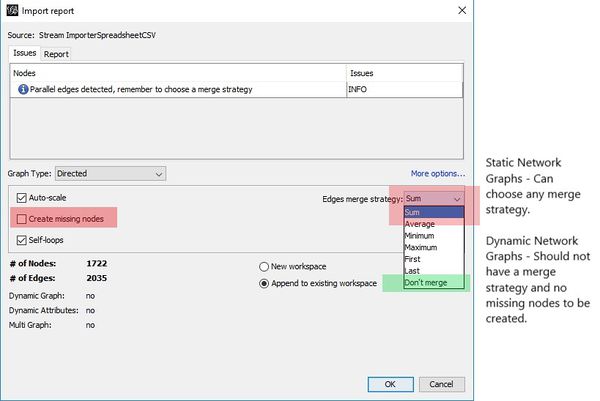
For Dynamic graph we should not have aggregated values for the observations. So we need to select the ‘Don’t Merge’.
But for Static network graphs we can merge the rows. |
|
|
Create Time Interval for Dynamic Network Graph. |
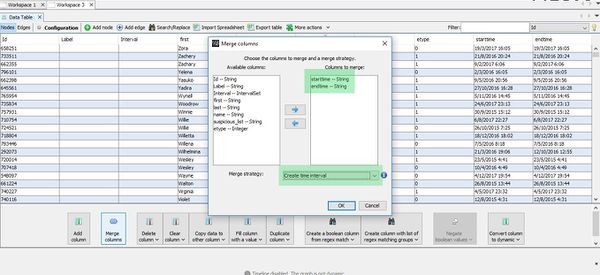
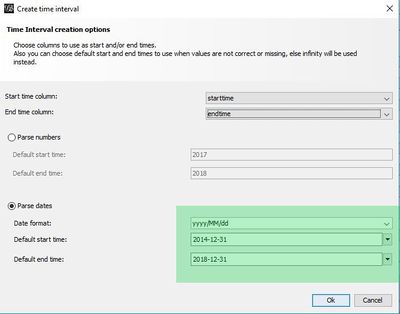
After importing Intervals have to be created which can be used by gephi to recognize the time range for which a value will be present in graph and how it can change dynamically.
For time interval we need to merge Start Date and End Date columns in the merge column option and choose appropriate time range to create the correct interval values.
This has to be done for both Node and Edge list dataset. |
|
|
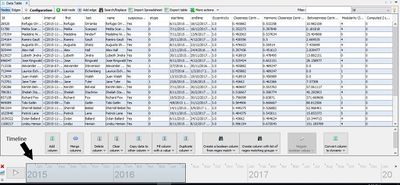
Enable TimeLine |
Once Interval values are created , the timeline option will be enabled which can set time range and gives a flexible frame to be used as slider. With this the changes in network graph with time can be observed once slider is moved. |
|
