Difference between revisions of "MU FUYAO Questions-answer"
| Line 85: | Line 85: | ||
=Question 3= | =Question 3= | ||
After reviewing the data, do any of your findings cause particular concern for the Pipit or other wildlife? Would you suggest any changes in the sampling strategy to better understand the waterways situation in the Preserve? | After reviewing the data, do any of your findings cause particular concern for the Pipit or other wildlife? Would you suggest any changes in the sampling strategy to better understand the waterways situation in the Preserve? | ||
| + | |||
| + | <table> | ||
| + | <table border='1'> | ||
| + | <tr> | ||
| + | <th>Year</th> | ||
| + | <th>Graph</th> | ||
| + | </tr> | ||
| + | <tr> | ||
| + | <td><b> 1.Year1998 </b> | ||
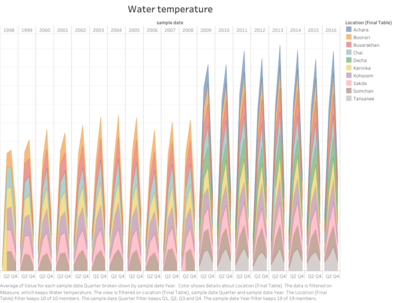
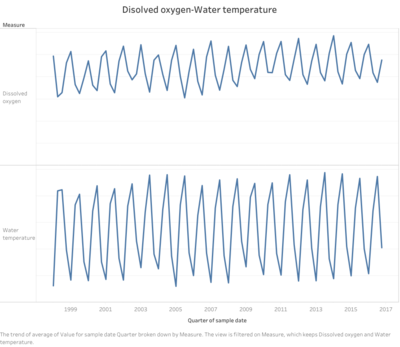
| + | <br>Water temperature went high trend from 2009. And from graph we can see temperature have seasonal patterns, it lead to dissolved oxygen have seasonal patterns. When temperature goes higher, dissolved oxygen goes down. They two have negative relationships | ||
| + | |||
| + | </td> | ||
| + | <td>[[File:Year1998.png|500px|center]]</td> | ||
| + | </tr> | ||
| + | |||
| + | <tr> | ||
| + | <td><b> 2.Year2016 </b> | ||
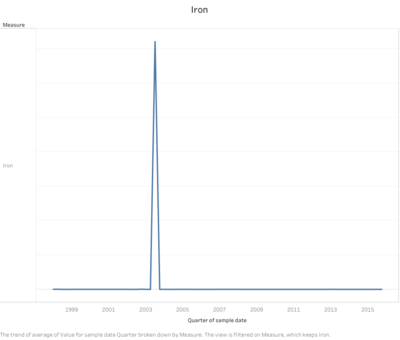
| + | <br> Quantity of Iron had an extremely increase in 2003 Q3. And it much more higher than every other years and quarters. There must be some uncommon events in that quarter or its sample datas have something wrong | ||
| + | |||
| + | </td> | ||
| + | <td>[[File:Year2016.png|500px|center]]</td> | ||
| + | </tr> | ||
| + | </table> | ||
Revision as of 21:08, 8 July 2018
|
|
|
|
|
Question 1
Characterize the past and most recent situation with respect to chemical contamination in the Boonsong Lekagul waterways. Do you see any trends of possible interest in this investigation?
| Statement | Graph |
|---|---|
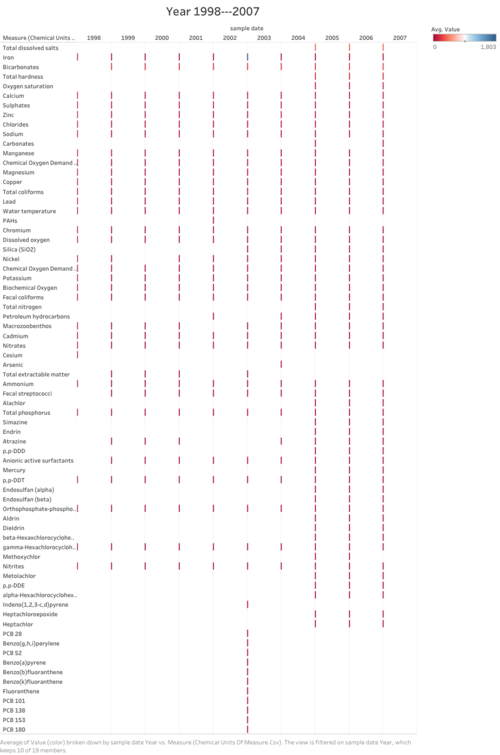
| 1.Year 1998---2007
There are some strange values in this dataset. For same location, same time and same measure, but there are different values. I think it’s repetitive value. So, I get average of them. |
|
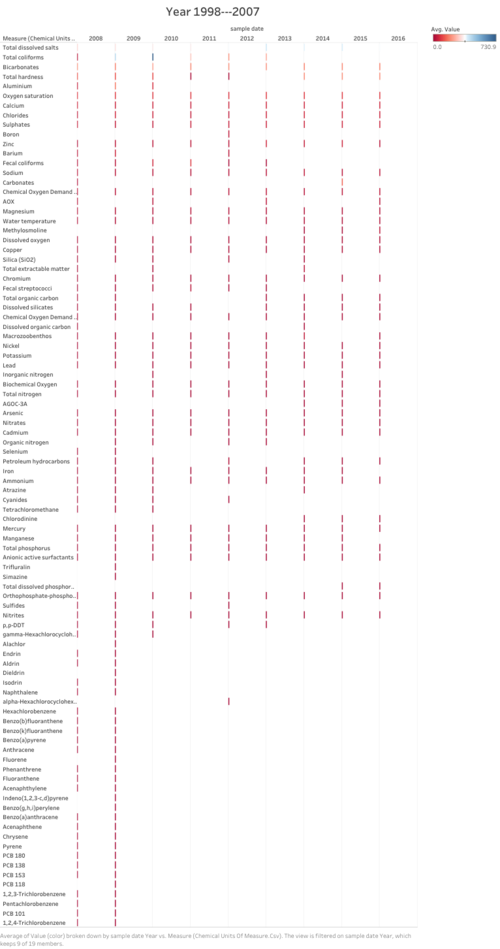
| 1.Year 2008---2016
There are some strange values in this dataset. For same location, same time and same measure, but there are different values. I think it’s repetitive value. So, I get average of them. |
Question 2
What anomalies do you find in the waterway samples dataset? How do these affect your analysis of potential problems to the environment? Is the Hydrology Department collecting sufficient data to understand the comprehensive situation across the Preserve? What changes would you propose to make in the sampling approach to best understand the situation?
| Anomalies | Graph |
|---|---|
| 1.Water temperature
|
|
| 2.Iron
|
Question 3
After reviewing the data, do any of your findings cause particular concern for the Pipit or other wildlife? Would you suggest any changes in the sampling strategy to better understand the waterways situation in the Preserve?
| Year | Graph |
|---|---|
| 1.Year1998
|
|
| 2.Year2016
|

