MU FUYAO Analytical Results
|
|
|
|
|
Analytical Results
View the interactive Tableau design here:[1]
Split Data
There are over hundred measures for our water quality testing. But not all of them are necessary for our research. Input all of the measures in my analysis will misleading results and have negative influences on parameters.
But for more accurate results, I have to make graphs for all measures first then choose some to make further research.
1. For all measures
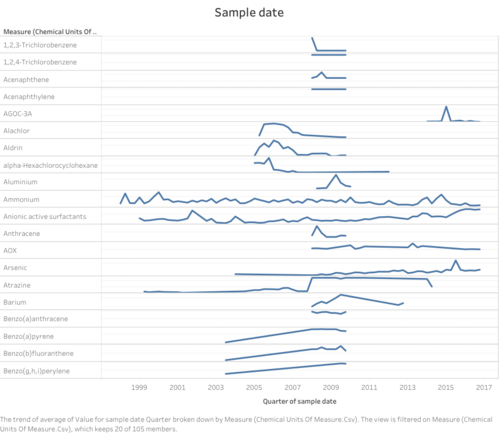
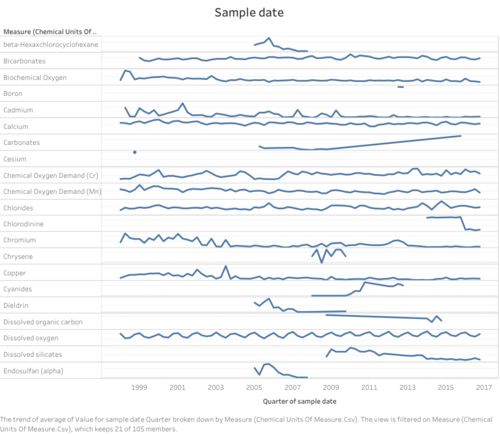
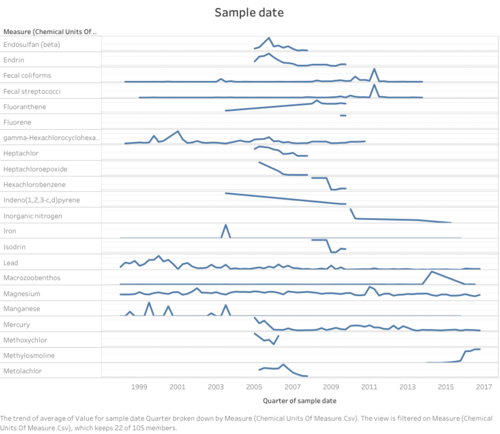
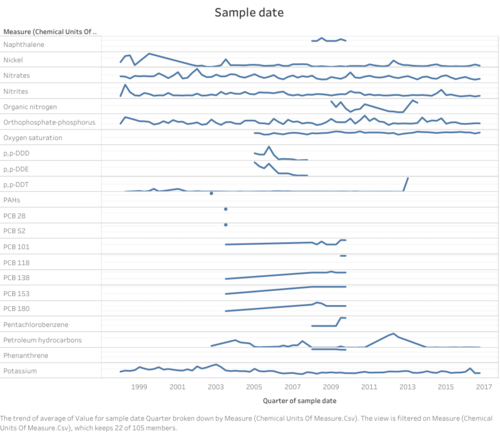
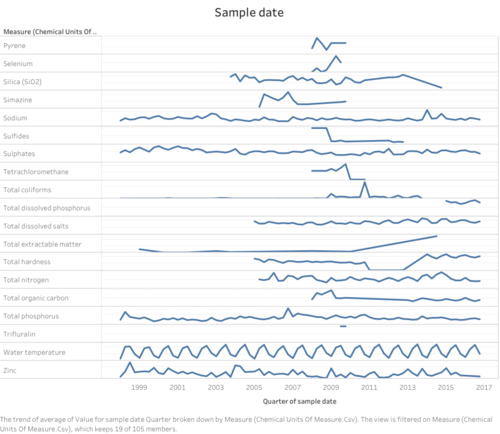
These five graphs show different measures' changes over the years. We can see changes for these measures are totally different. Some of them have no meaning for their patterns. But some do have seasonal patterns or year patterns.
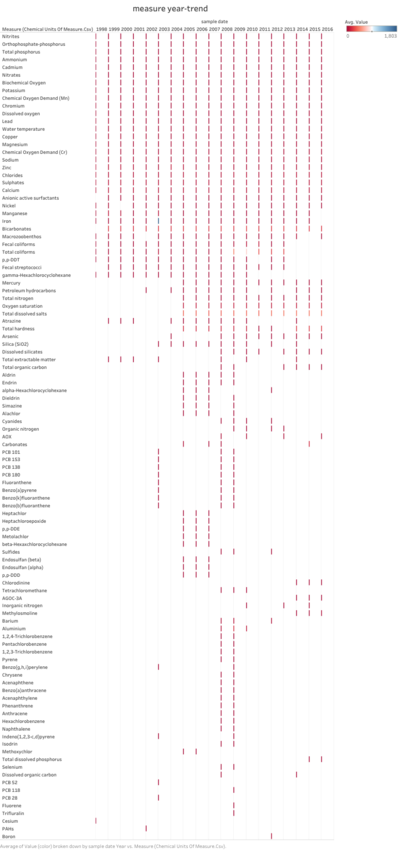
This graph show all measures year-trend from 1998-2016, we can see some measures were tested overs years and some were tested for one or two years. Which means that not all measures are tested in a year. For quality tester, they only choose some of them to test. And from this graph, we can see most measures were tested in 2008,2009 and 2014-2016.
2. For selected measures
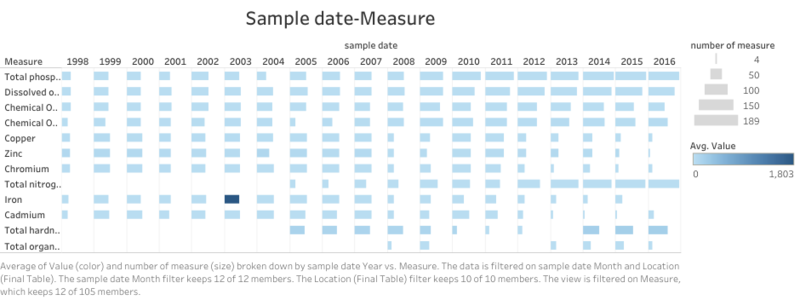
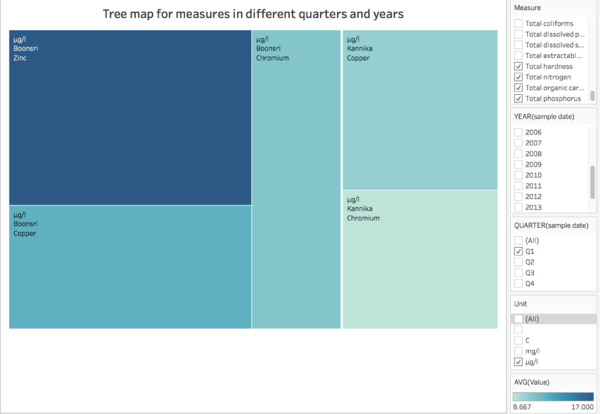
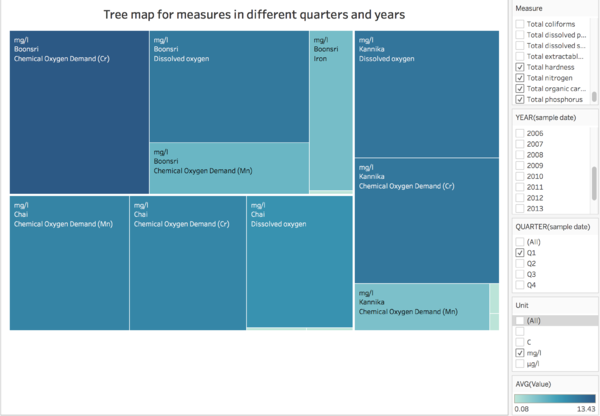
I checked some reference book and selected some measures for common water quality tested. Not all measures are suitable for water quality testing. In research, I choose some organic chemicals and other chemicals for water pollution. Changes for these chemicals may lead to changing in pollutions.
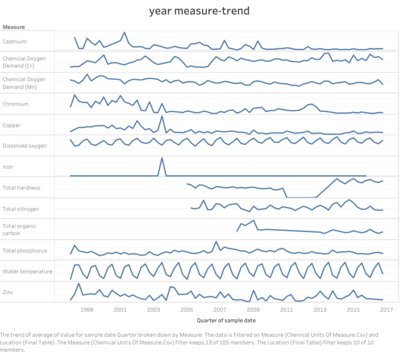
We can see from this graph, most measures are in average range. But for iron, in 2003 quarter 3, it shows a extremely raising trend and made a peak for its trend. It influenced yearly trendy for iron. So, there must be some problems or uncommon events in Q3,2003
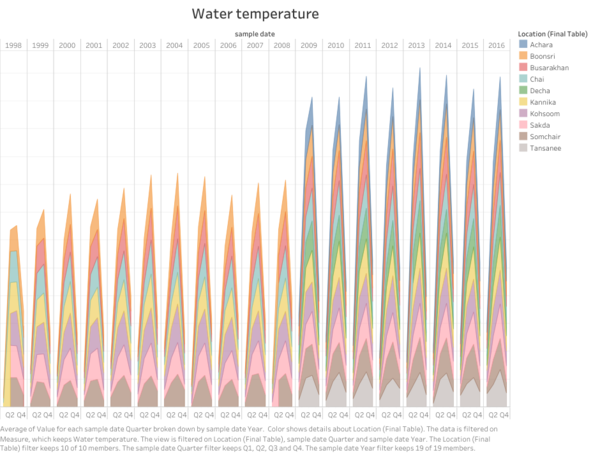
3. Water temperature
Water temperature is a very important measure for water quality testing. If we want to do research for pollution. We have to consider influence of water temperature

