Difference between revisions of "ISSS608 2017-18 T3 Assign Zhang Yingdi Task1"
Ydzhang.2017 (talk | contribs) |
Ydzhang.2017 (talk | contribs) |
||
| Line 33: | Line 33: | ||
Next, the date format in column '''Date''' is not standardized, most of the rows are in format mm/dd/yy. However, there some rows with different date format yyyy-mm-dd, all these records are recoded to format mm/dd/yy. | Next, the date format in column '''Date''' is not standardized, most of the rows are in format mm/dd/yy. However, there some rows with different date format yyyy-mm-dd, all these records are recoded to format mm/dd/yy. | ||
| − | [[File:Task1-1-.png|center| | + | |
| + | [[File:Task1-1-.png|center|600px]] | ||
| + | |||
Change the data type of Date column from “Character” to “Numeric”, Modelling type from “Nominal” to “Ordinary”, Format to “m/d/y”. | Change the data type of Date column from “Character” to “Numeric”, Modelling type from “Nominal” to “Ordinary”, Format to “m/d/y”. | ||
| − | [[File:Task1-2-.png|center| | + | |
| + | [[File:Task1-2-.png|center|300px]] | ||
| + | |||
Check and make sure there are no missing values in the Date column. | Check and make sure there are no missing values in the Date column. | ||
| − | [[File:Task1-3-.png|center| | + | |
| + | [[File:Task1-3-.png|center|150px]] | ||
| + | |||
Next, check values in X and Y columns, there are two rows with “?” in the Y column, delete these two rows from the data table. | Next, check values in X and Y columns, there are two rows with “?” in the Y column, delete these two rows from the data table. | ||
| + | |||
[[File:Task1-4-.png|center|500px]] | [[File:Task1-4-.png|center|500px]] | ||
| + | |||
| + | |||
| + | ==Data Analysis == | ||
| + | |||
| + | To figure out if there is any trends or anomalies in the patterns of all of the bird species over the time of collection, we will first visualize the distribution of all bird species over the years of collection. Since the number of all bird species increase from 2005, there are only few number of bird records before year 2015, hence we will only use the data from year 2005 onwards, the data from year 2018 is also excluded since now is still in the mid of 2018 and there are not enough records collected for year 2018. | ||
| + | |||
| + | |||
| + | [[File:Task1-7-.JPG|center|800px]] | ||
| + | |||
| + | |||
| + | From the distribution of the all bird species over years, we can find that: | ||
| + | * The number of all bird species increase from 2005. | ||
| + | * With different colours indicating different bird species, it shows that over the years, different species of birds tend to form their own clusters instead of distributing all over the place randomly. | ||
| + | * From the distribution, it seems like the total number of bird’s records increase from 2005 to around 2016, then start to decrease. Now we will use line graph to find out if the number of bird's records indeed change like the observation from the distribution graph. | ||
| + | |||
| + | Below shows the line graph of the number of birds records by species over years. | ||
| + | |||
| + | |||
| + | [[File:Task1-8-.png|center|800px]] | ||
| + | |||
| + | |||
| + | From the line graph, we can see the change of number of records for different bird species over the years are different. The number of records for some of the species remains stable or increased over the years; some of the species have an increase of records around year 2013, then experienced a drop on the number of records. Where else, some of the species had a sharp increase of number of records around 2015 and have a relatively sharp decrease after 2015. With this observation, we will cluster the bird’s species according to their change patterns over the years of collection. The species are clustered to three clusters. | ||
| + | |||
| + | Cluster 1 – Bird species of stable number of records over years | ||
| + | This cluster contains the species that have a stable number or increasing number of record over the years of collection. | ||
| + | |||
| + | |||
| + | [[File:Task1-9-.png|center|700px]] | ||
Revision as of 19:36, 8 July 2018
|
|
|
|
|
|
The objective of this question is to use the bird call collection and the included map of the Wildlife Preserve, characterize the patterns of all the bird species in the Preserve over the time of the collection and detect if there are any trends or anomalies in the patterns. The analysis of this question is conducted in Tableau.
Data Preparation
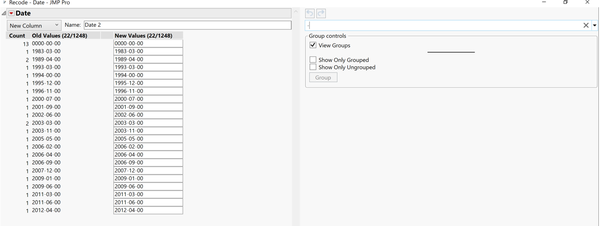
Import file AllBirdsv4.csv into JMP, in column Date, there are 13 records with values “0000-00-00”, these 13 records are considered as missing information and are removed from the dataset. Next, the date format in column Date is not standardized, most of the rows are in format mm/dd/yy. However, there some rows with different date format yyyy-mm-dd, all these records are recoded to format mm/dd/yy.
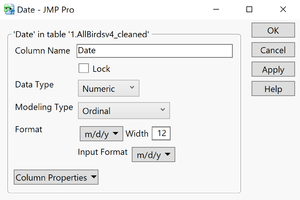
Change the data type of Date column from “Character” to “Numeric”, Modelling type from “Nominal” to “Ordinary”, Format to “m/d/y”.
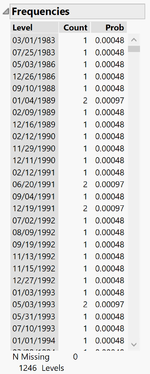
Check and make sure there are no missing values in the Date column.
Next, check values in X and Y columns, there are two rows with “?” in the Y column, delete these two rows from the data table.
Data Analysis
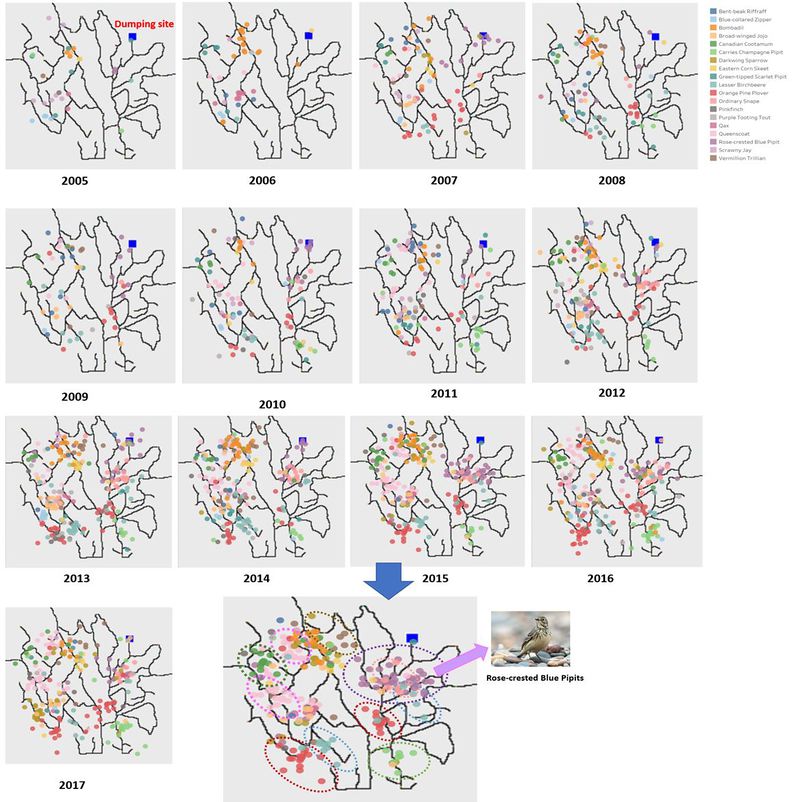
To figure out if there is any trends or anomalies in the patterns of all of the bird species over the time of collection, we will first visualize the distribution of all bird species over the years of collection. Since the number of all bird species increase from 2005, there are only few number of bird records before year 2015, hence we will only use the data from year 2005 onwards, the data from year 2018 is also excluded since now is still in the mid of 2018 and there are not enough records collected for year 2018.
From the distribution of the all bird species over years, we can find that:
- The number of all bird species increase from 2005.
- With different colours indicating different bird species, it shows that over the years, different species of birds tend to form their own clusters instead of distributing all over the place randomly.
- From the distribution, it seems like the total number of bird’s records increase from 2005 to around 2016, then start to decrease. Now we will use line graph to find out if the number of bird's records indeed change like the observation from the distribution graph.
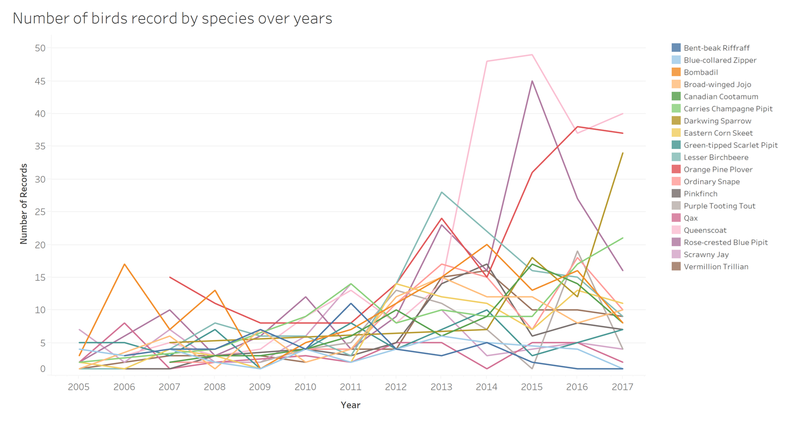
Below shows the line graph of the number of birds records by species over years.
From the line graph, we can see the change of number of records for different bird species over the years are different. The number of records for some of the species remains stable or increased over the years; some of the species have an increase of records around year 2013, then experienced a drop on the number of records. Where else, some of the species had a sharp increase of number of records around 2015 and have a relatively sharp decrease after 2015. With this observation, we will cluster the bird’s species according to their change patterns over the years of collection. The species are clustered to three clusters.
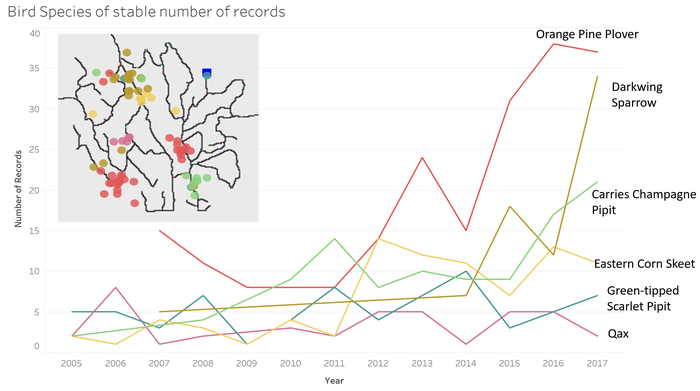
Cluster 1 – Bird species of stable number of records over years This cluster contains the species that have a stable number or increasing number of record over the years of collection.
