ISSS608 2017-18 T3 Assign Zhang Yingdi Task2
|
|
|
|
|
|
|
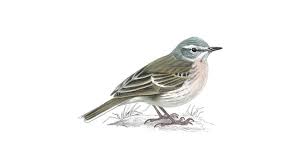
Kasios are reporting that there are plenty of Rose-crested Blue Pipits happily living and nesting in the Preserve. They have provided a set of Pipit bird calls, recently recorded across the Preserve, with locations of where they were recorded. They claimed the Rose-crested Blue Pipits are a thriving population.
The objective of this question is to investigate if the claim by Kasios are factual. To support the investigation, both Machine Learning approach and Visualization Approach are applied. This question is mainly explored in R and Tableau.
Data Preparation
R is used for the data preparation. The audio files in the “ALL BIRDS” folder will be used to train and test the model. The audio files in the “Test Birds from Kasios” folder will be used to predict the outcome. For the Machine Learning approach, a classifier will be built to predict if the given 15 test audio files are Pipit bird calls.
All the audio files are given in MP3 format. To analyse the audio files, firstly, the MP3 files are converted to .wav format using wirteWav() function. Next, convert the .wav files to data frame using the analyzeFolder() function. Due to the long-time of processing large number of files, only audio files with quality “A” in “ALL BIRDS” folder is selected to be used in this question. The result of the analyzeFolder() for audio files in “ALL BIRDS” folder and “Test Birds from Kasios” folder are saved as “all_birds_wav.csv” and “test_birds_from_kasios_wav.csv” respectively.
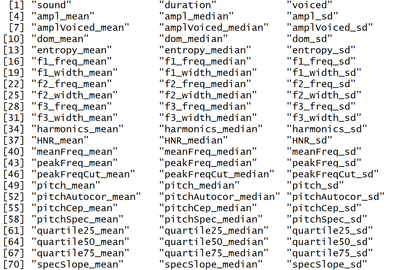
The converted .csv files contains 72 columns shown as below:
Column sound is the .wav files name. The rest columns are all parameters of the audio files with numeric values.
A new column with the bird name is added to the data table.
Next, a new column with target variable is added to the data table. As the classifier will predict if the test birds are Rose-crested Blue Pipits or not, there will be two values “Rose Pipit” and “not Rose Pipit” in the new column Target.
Next, column sound is removed since it is the .wav files name and will not be used for building the model.
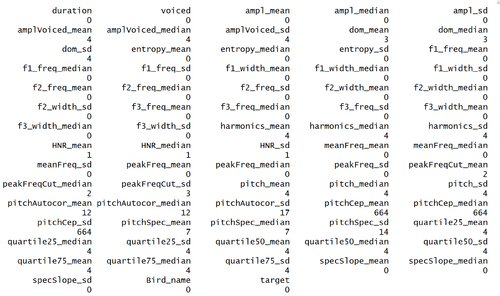
Next, missing values are checked for all the columns and rows. Below shows the number of missing values in all the columns. It shows that all rows of columns "pitchCep_median","pitchCep_sd" and "pitchCep_mean" are filled with “NA”. Hence, these three columns are removed. Besides, the rows with “NA” are also removed from the data.
Lastly, move the column Target to the first column for the ease of building the classifier in the later stage.
Machine Learning Approach
The objective of the model will be to predict if the test bird is Rose-crested Blue Pipits. Two classification models Random Forest and Decision Tree are built in this assignment. Decision Tree outputs are easily comprehensible, and its graphical representation is intuitive, it also requires a lesser data cleaning compared to other algorithms. The data are split into 70% training data and 30% test data.
Random Forest
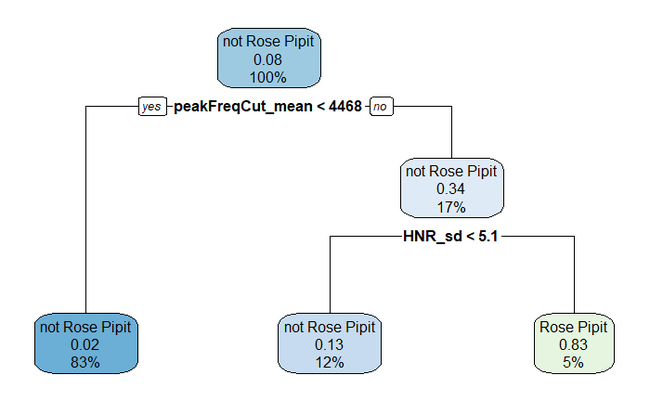
A Random Forest model is built, the accuracy rate of the model tested with test data is 0.96. A Decision Tree model is built with an accuracy rate of 0.94. The Decision Tree is plotted for better visualization. It shows there are two splits at parameters peakFreqCut_mean and HNR_sd.
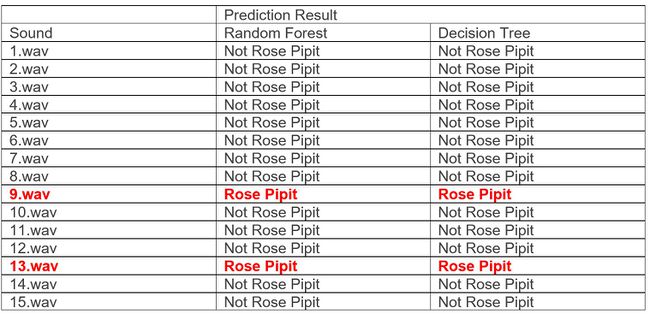
Next, the Random Forest and Decision Tree model are used to predict if the 15 bird calls given by Kasios contains Rose Pipit calls. Below shows the prediction result of the 15 birds with the Random Forest Model and Decision Tree Model:
Both models give the same prediction result, audio file 9 and 13 are predicted to be Rose Pipit. To further investigate if the model gives the correct prediction, Visualization approach is also used for this task.
Visualization Approach
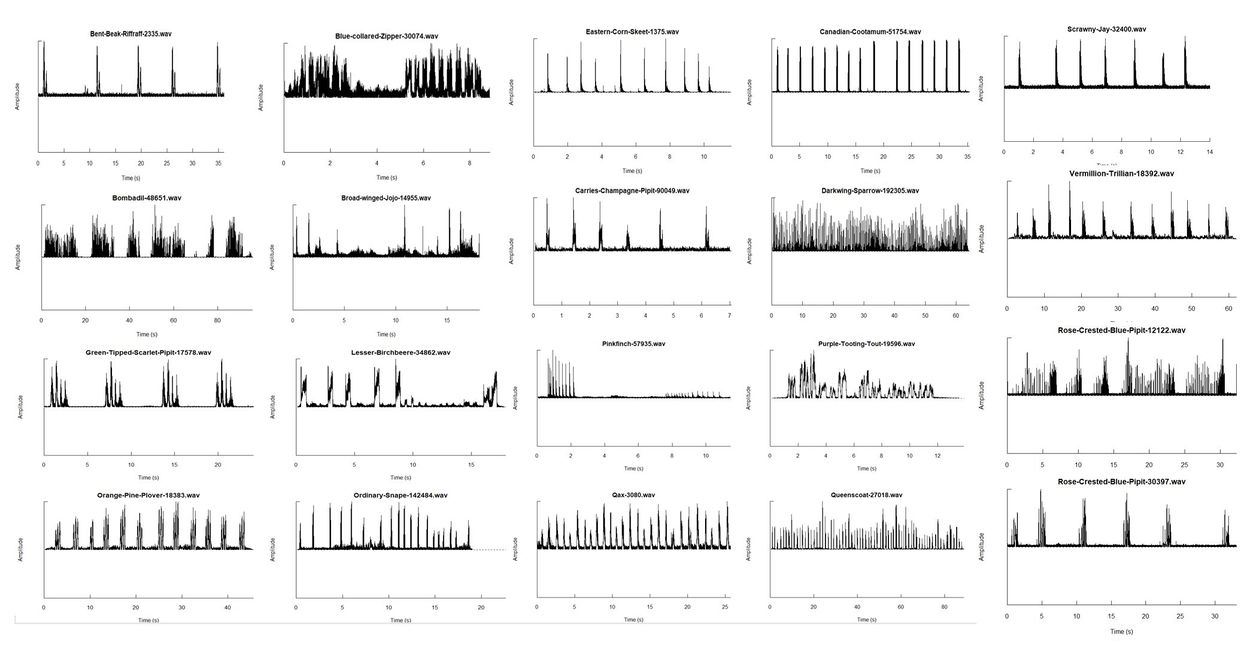
Firstly, the amplitude waves for the 19 different bird species are plotted. Five audio files for each specie have been randomly chosen to plot the amplitude waves. Env() function in R is used to plot the Hilbert amplitude envelope plots for all the 19 species. Besides Rose Pipit, one representative Hilbert amplitude envelope was chosen to represent each species. Since Rose Pipit is the target species, hence two representative amplitude envelope plots are chosen. Below show the chosen Hilbert amplitude envelope plots for all the bird species.
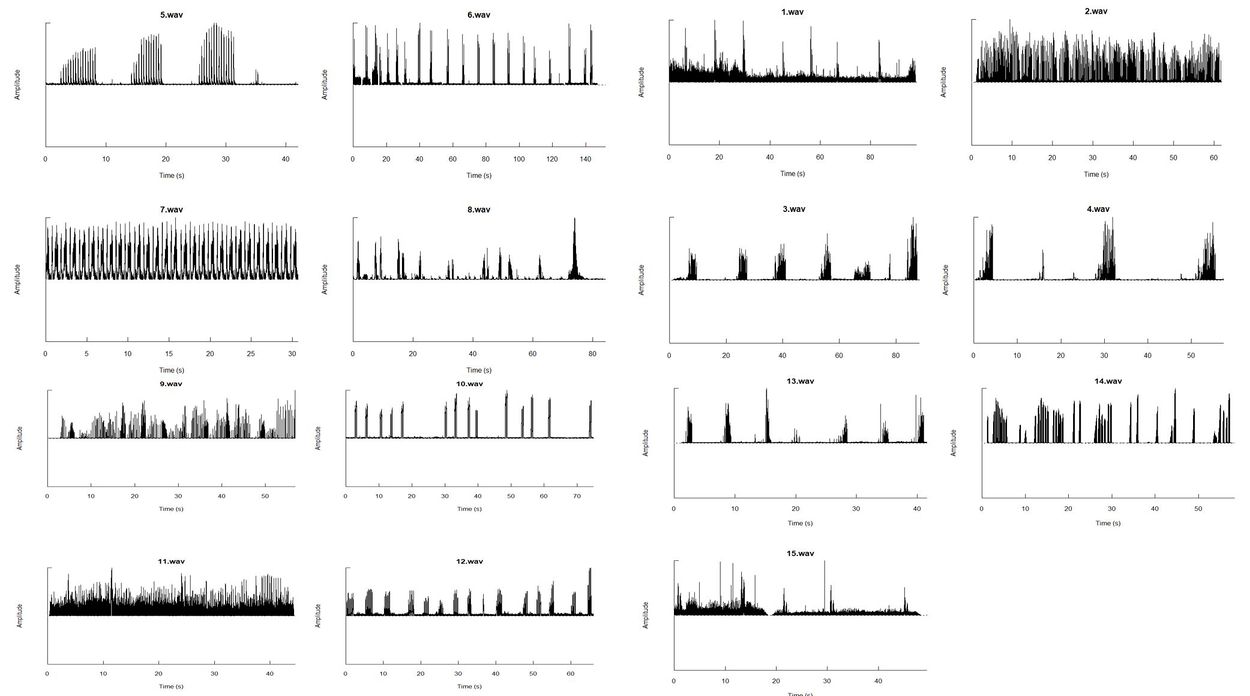
The plots show that the amplitude envelope plots have different characteristics for different bird species. They have different frequency and amplitude ranges. After the study and observation of the amplitude plots, the Hilbert amplitude envelope plots for the 15 test birds given by Kasios are plotted.
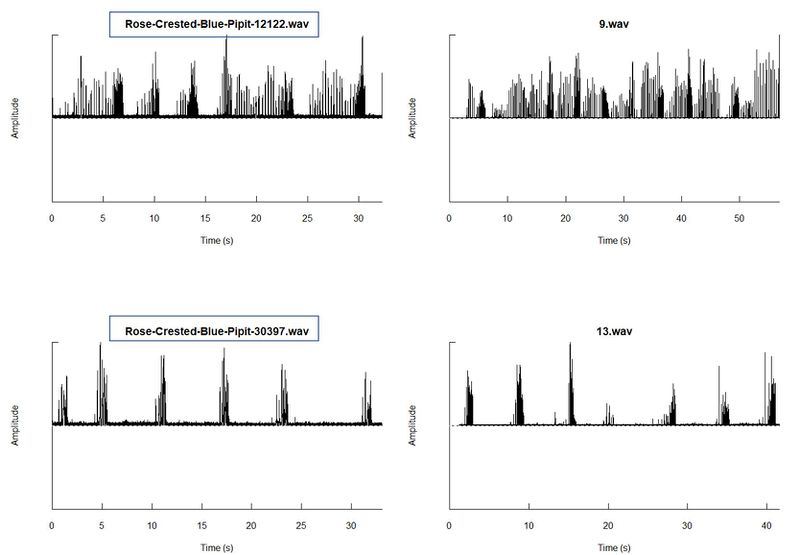
By visualizing and comparing the amplitude envelope plots, we identify the test bird 9 and 13 are Rose-Crested-Blue-Pipit. The amplitude envelope plots for Rose-Crested-Blue-Pipit and the test bird 9 and 13 are shown as below for easy comparison. The below graph shows that test bird 9 and 13 have similar frequency and amplitude with the Rose-Crested-Blue-Pipit amplitude envelope plot.
This result is tally with the prediction result in the Machine Learning Approach.
Next, to future confirm our findings. We will manually identify the most important features for identifying if the bird is Rose-Crested-Blue-Pipit. By comparing the characteristics of these important features between the true Rose-Crested-Blue-Pipit and the test bird, we can identify if the test birds are Rose-Crested-Blue-Pipit.
There are 71 variables in the “all_birds_wav.csv” file, not all the variables are useful for the identification of the Rose-Crested-Blue-Pipit, and there are some highly correlated variables, all these variables will be removed.
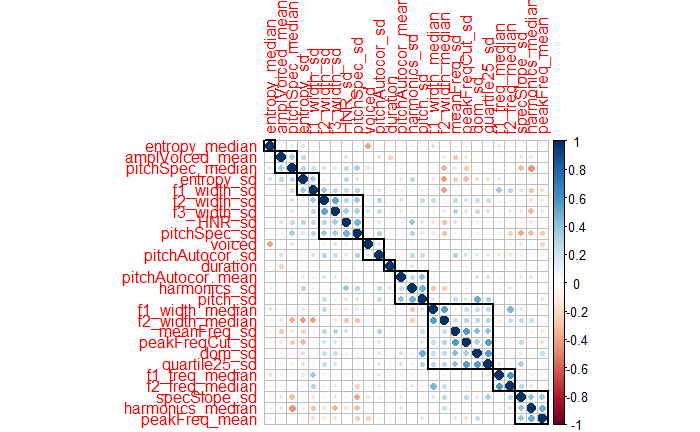
Firstly, we will remove the variables with correlation higher than 0.6 by using findCorrelation() function in R. There are 26 variables left after this step. Next, correlation plot is plotted to manually identify the rest highly correlated variables. Rectangles are drawn based on clustering of 10.
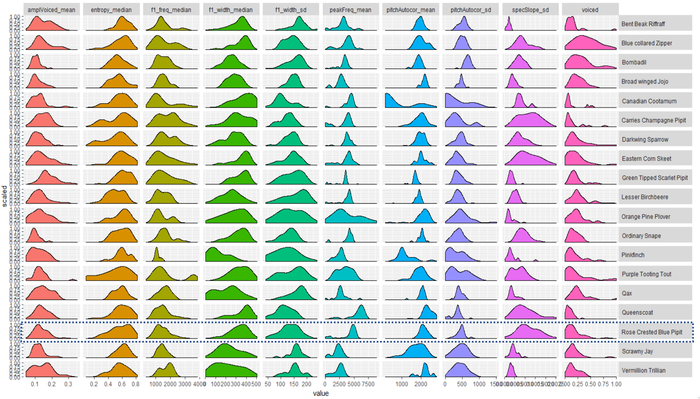
Based on the correlation plot, we have identified and removed the highly correlated variables in each cluster, each cluster only left with one variable. The ten selected important variables are "amplVoiced_mean","entropy_median","f1_freq_median", "f1_width_median", "f1_width_sd","peakFreq_mean", "pitchAutocor_mean”, "pitchAutocor_sd", "specSlope_sd" and "voiced". The trellis density plot is plotted as below:
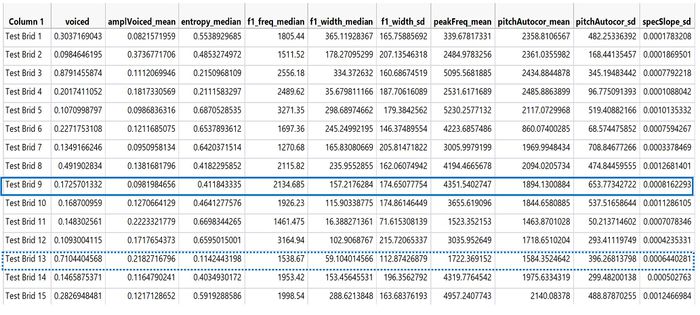
The selected 10 variables of the test birds are tabulated in the below table:
By comparing these variables with the distribution of the Rose-Crested-Blue-Pipit in the trellis density plot, we observe that only test bird 9 is Rose-Crested-Blue-Pipit.
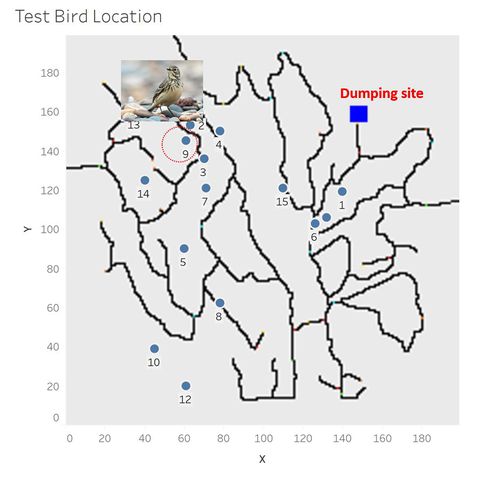
Next, the location of the bird 9 is plotted, below picture shows that the bird 9 is not near the dumping site. Though bird 9 is predicated to be Rose-Crested-Blue-Pipit, but they are not near the dumping site, future more, there are only one bird predicated to be Rose-Crested-Blue-Pipit out of the 15 birds, hence Kasios’s claims that there are plenty of Rose-crested Blue Pipits happily living and nesting in the Preserve are doubted.
From this task, we can see that to investigate if the 15 test birds are Rose-Crested-Blue-Pipit, both Machine Learning and Visualization approached are used for the investigation. Machine Learning approach is used first to predict whether the test birds are Rose-Crested-Blue-Pipit. However, unlike visualization approach with human interpretation during the exploration, Machine learning approach is lack of variability. Hence Visualization approach is also applied to further verify the machine learning prediction result. In this task, the machine learning method predict both test bird 9 and test bird 13 are Rose-Crested-Blue-Pipit, however, we identified test bird 13 might not be Rose-Crested-Blue-Pipit through the Visualization method. This helps to improve the accuracy of the predication result. Hence, a combination of Machine Learning and Visualization methods will be a good way for the investigation.
