Difference between revisions of "Group01 Dataset Overview"
| Line 95: | Line 95: | ||
! Field # !! Dataset Field !! Comments !! Details | ! Field # !! Dataset Field !! Comments !! Details | ||
|- | |- | ||
| − | | | + | | 1 || datatime || Packet Arrival Date || From 03/03/2013, 09:53:00PM |
| + | To 07/24/2013 07:47:00AM | ||
| + | 185k entries | ||
| + | |||
|- | |- | ||
| Example || Example || Example || Example | | Example || Example || Example || Example | ||
Revision as of 22:25, 22 July 2018
LINK TO PROJECT GROUPS:
Please Click Here -> [1]
|
|
|
|
|
|
|
|
|
|
Contents
What is Honeypot?
In simple terms, Honeypot is a trap for network attacks, and it records the IP addresses of such attacks.
As described by Amazon Web Service (AWS)[2], a honey pot is a security mechanism intended to lure and deflect an attempted attack. AWS’s honey pot is a trap point that one can insert into website to detect inbound requests from content scrapers and bad bots. The IP addresses are recorded if a source accesses the honeypot.
Overview of the AWS Honeypot Cyberattack
The test dataset of AWS Honeypot Cyberattack is retrieved from Kaggle,https://www.kaggle.com/casimian2000/aws-honeypot-attack-data/data
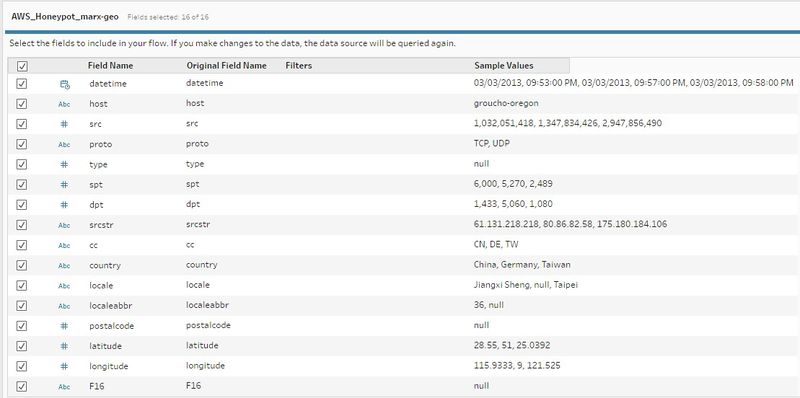
We use Tableau Prep to run an overview of the data before any analysis.
Analysis of Data fields
| Field # | Dataset Field | Comments | Details |
|---|---|---|---|
| 1 | datatime | Packet Arrival Date | From 03/03/2013, 09:53:00PM
To 07/24/2013 07:47:00AM 185k entries |
| Example | Example | Example | Example |
| Example | Example | Example | Example |
The interpretation of the data sets have been assisted with below reference.
https://emreovunc.com/projects/honeypots_data_analysis.pdf
https://www.kaggle.com/jonathanbouchet/aws-honeypot/notebook
What to analysis?
Without a doubt, the dataset requires data cleaning as the work proceeds. However, based on the analysis of the field, it is clear that
- The targets/destinations are 8 different servers (host)
- The attackers are from various sources around the world
- IP addresses
- Counties + cities
- Postcode + Geographic data
- Time log is available
We can run a few analyses
- Basic statistics of the data
- Advance visualisation of the data
- Animation of attacks showing “Origin Vs Destination” over the time log
