Group01 Dataset Visualisation
Jump to navigation
Jump to search
LINK TO PROJECT GROUPS:
Please Click Here -> [1]
|
|
|
|
|
|
|
|
|
|
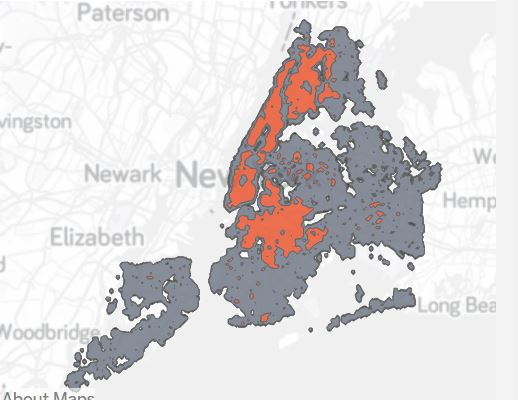
For Geo-location visualisation, we intend to use Heatmap method and flowchart. Heatmap is used to visualise the intensity of attacks over different geographical areas.

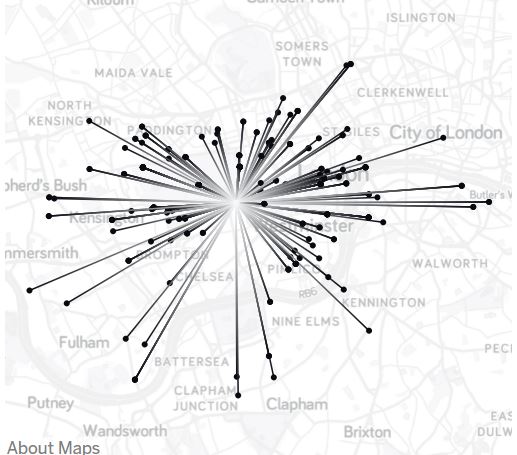
Flow map is to show the source of the attack and which countries the attack is targeting.

(P/S: Pictures shown above are just examples for easier showcasing during consultation. Actual distribution will be based on actual dataset)