Difference between revisions of "ISSS608 2017-18 T3 Assign Harisingh Q3"
Jump to navigation
Jump to search
| Line 25: | Line 25: | ||
|} | |} | ||
| − | + | For last part of analysis, I have focused more on chemicals which are toxic in nature. The changes in these chemicals can ultimately harm the preserve wildlife. | |
| − | + | In Busarakhan and Somchair, the concentration of ALL toxic chemicals has followed an upward trend since 2009 onwards. While discussing chemical-wise distribution for Q1, we found out that these locations seem to have geo-spatial relationship in terms of changes in chemical concentration | |
| − | + | [[File:h_chart20.png||700px]] | |
Revision as of 04:33, 9 July 2018
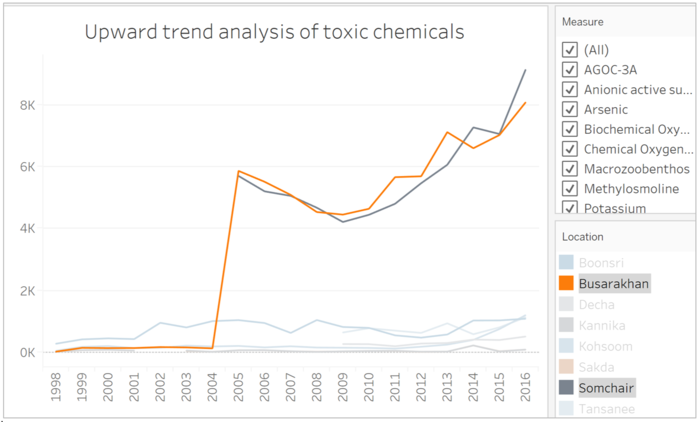
For last part of analysis, I have focused more on chemicals which are toxic in nature. The changes in these chemicals can ultimately harm the preserve wildlife.
In Busarakhan and Somchair, the concentration of ALL toxic chemicals has followed an upward trend since 2009 onwards. While discussing chemical-wise distribution for Q1, we found out that these locations seem to have geo-spatial relationship in terms of changes in chemical concentration

