Difference between revisions of "ISSS608 2017-18 T3 Assign ONG WAH JIE Data Preparation"
Jump to navigation
Jump to search
| Line 2: | Line 2: | ||
==1. Creating waterway map and location.csv== | ==1. Creating waterway map and location.csv== | ||
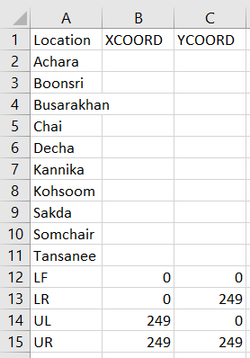
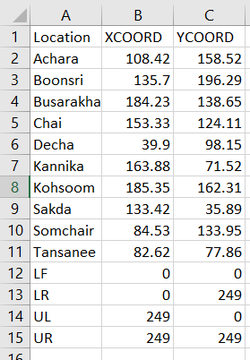
Import a location.csv file as shown below into tableau. | Import a location.csv file as shown below into tableau. | ||
| − | [[File:Owj-d_(1).png| | + | [[File:Owj-d_(1).png|250px|center|border]] |
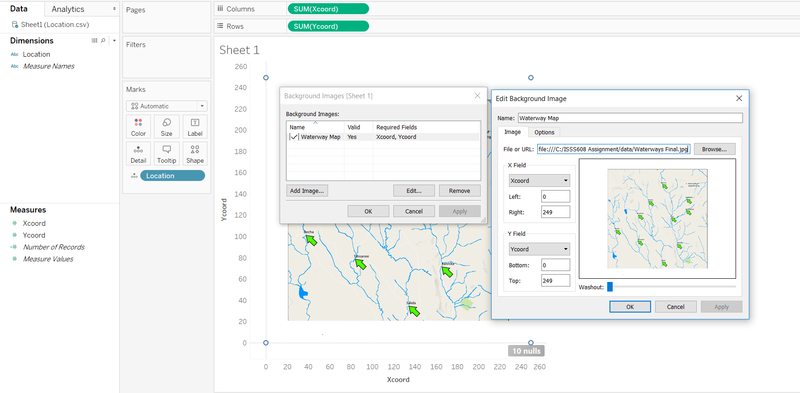
Select according to the print-screen below to get the image of the waterway to appear in tableau. | Select according to the print-screen below to get the image of the waterway to appear in tableau. | ||
| Line 9: | Line 9: | ||
Click ok | Click ok | ||
| − | [[File:Owj-d_(4).png| | + | [[File:Owj-d_(4).png|250px|center|border]] |
| + | |||
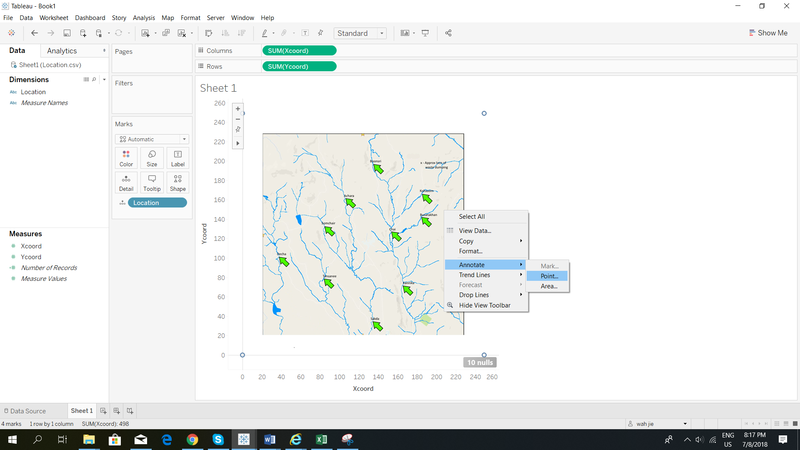
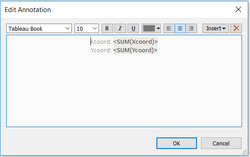
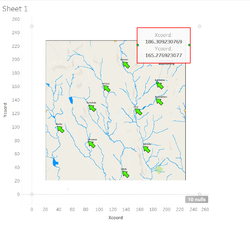
| + | Drag line which appears with the box to the tip of the arrows to get the x and y coordinates of the locations. | ||
| + | |||
| + | Populate the locations with the x and y coordinates obtained. | ||
| + | [[File:Owj-d_(5).png|250px|center|border]] | ||
| + | [[File:Owj-d_(6).png|250px|center|border]] | ||
Revision as of 21:45, 8 July 2018
Data Prep
1. Creating waterway map and location.csv
Import a location.csv file as shown below into tableau.
.png)
Select according to the print-screen below to get the image of the waterway to appear in tableau.
.png)
.png)
Click ok
.png)
Drag line which appears with the box to the tip of the arrows to get the x and y coordinates of the locations.
Populate the locations with the x and y coordinates obtained.
.png)
.png)