Difference between revisions of "ISSS608 2017-18 T3 Assign Kaushik Jaganathan - Insights and Conclusion"
| Line 78: | Line 78: | ||
2. Decha <br/> | 2. Decha <br/> | ||
3. Tansanee <br/> | 3. Tansanee <br/> | ||
| + | |||
| + | |||
| + | [[Image:adt.png|700px]]<br/> | ||
Revision as of 19:24, 8 July 2018
ISSS608 2017-18 Mini Challenge 2 - Kaushik Jaganathan
|
|
|
|
|
Question 1
Characterize the past and most recent situation with respect to chemical contamination in the Boonsong Lekagul waterways. Do you see any trends of possible interest in this investigation?
The data for chemicals across locations is present from 1998-2016. For this analysis, I am considering only chemicals which have more than 200 records over all locations during this time. The threshold is set at 200 since there are totally 18*12=216 months in this period and at least one reading a month is required. So, the following chemicals haven’t been considered for this analysis for having too few records.
1,2,3-Trichlorobenzene
1,2,4-Trichlorobenzene
Acenaphthene
Acenaphthylene
Anthracene
Benzo(a)anthracene
Benzo(a)pyrene
Benzo(b)fluoranthene
Benzo(g,h,i)perylene
Benzo(k)fluoranthene
Berilium
Boron
Carbonates
Cesium
Barium
Aluminium
Chrysene
Dissolved organic carbon
Fluoranthene
Fluorene
Hexachlorobenzene
Indeno(1,2,3-c,d)pyrene
Inorganic nitrogen
Isodrin
Methoxychlor
Naphthalene
Organic nitrogen
PAHs
PCB 101
PCB 118
PCB 138
PCB 153
PCB 180
PCB 28
PCB 52
Pentachlorobenzene
Phenanthrene
Pyrene
Selenium
Trifluralin
From plotting the chemical value against date, it is found out that 3 locations have values from 2009.
1. Achara
2. Decha
3. Tansanee
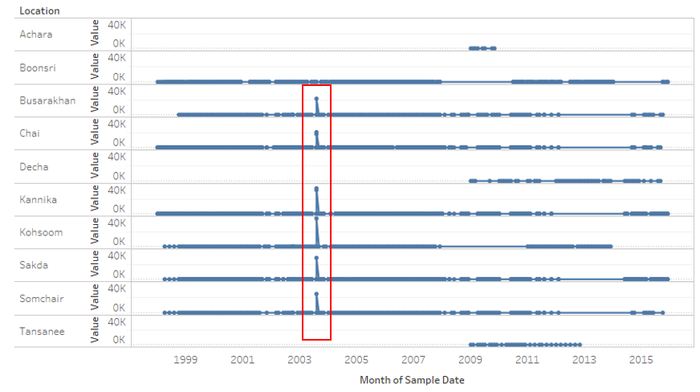
August 2003 - Iron spikes
From 1998-2016, across all locations, Iron has been following a normal trend except for in 2003 when a huge spike was observed across all locations
Let’s drill down to 2003 to find out more.
The average value for Iron in August 2003 is extremely high across all locations. This indicates that the entire waterway system of the Reserve was affected. According to WHO, in well-water, iron concentrations below 0.3 mg/litre are characterized as unnoticeable, whereas levels of 0.3–3 mg/litre are found acceptable. But the concentrations found during this period are almost 3000-6000 times more than the threshold.
Question 2
What anomalies do you find in the waterway samples dataset? How do these affect your analysis of potential problems to the environment? Is the Hydrology Department collecting sufficient data to understand the comprehensive situation across the Preserve? What changes would you propose to make in the sampling approach to best understand the situation? Is the Hydrology Department collecting sufficient data to understand the comprehensive situation across the Preserve?
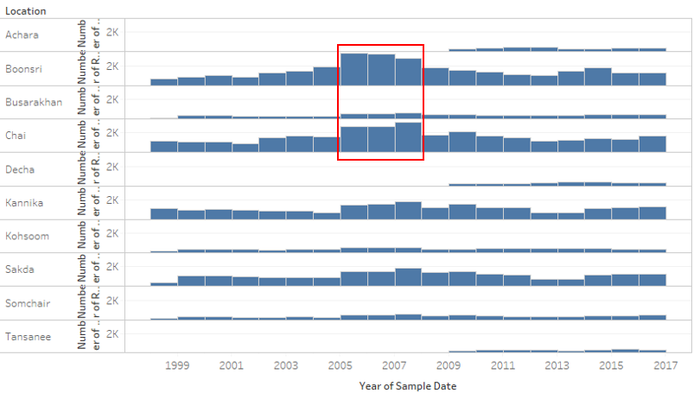
Boonsri and Chai over the years
Overall, considering all the chemicals, it is seen that Boonsri and Chai have had the maximum samples collected during 2005-2007. Also, Achara, Decha and Tansanee have samples only from 2009. Even though this image doesn’t give a very clear picture of what chemicals were sampled, it is at least noted that sampling was done regularly in Boonsri and Chai from 2005 to 2007. The samples have reduced recently when compared to that period in the image.
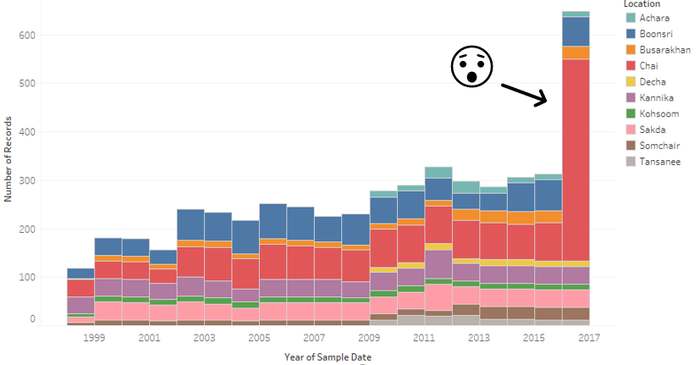
Water temperature - Chai - 2016
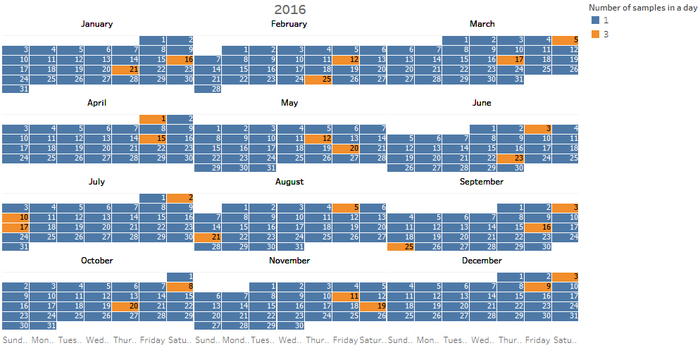
A very unusual and high number of sampling events for Water temperature is observed in Chai. Let’s have a look at the day wise breakdown of this sampling.
The day-wise breakdown doesn’t indicate any specific pattern in sampling except that almost all of the multiple one-day sampling events were either on Friday or Saturday.
It remains a mystery why the authorities were more active going into the weekend.
Question 3
After reviewing the data, do any of your findings cause particular concern for the Pipit or other wildlife? Would you suggest any changes in the sampling strategy to better understand the waterways situation in the Preserve?
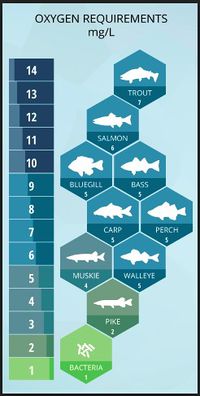
Dissolved oxygen is key to survival of aquatic life. Let’s have a look into DO patterns in the Reserve. The below image indicates that a level of atleast 5mg/L is required for most of the fish to survive.
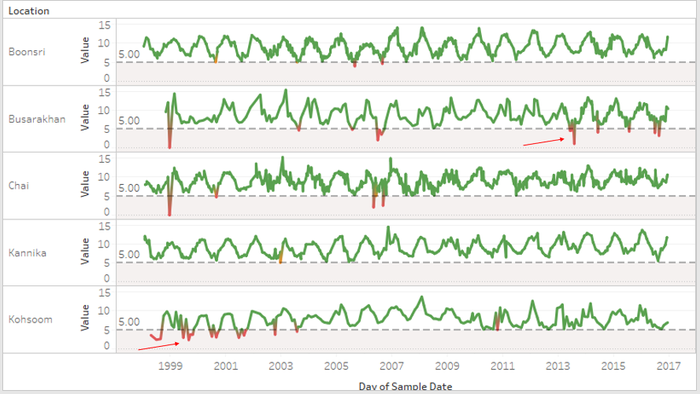
I have constructed a threshold at 5mg/L. DO levels above 5 are colored green and red when value falls below 5 and threatens aquatic life.
I have divided the locations into 4 streams and analysed the DO levels for all locations in a stream over time. In the above image, for locations in the stream 1 (Boonsri,Chai,Busarakhan,Kannika,Kohsoom), the DO levels at Busarakhan have been below threshold recently placing the aquatic species in danger. Kohsoom initially had low DO levels but in the recent years the levels are normal.
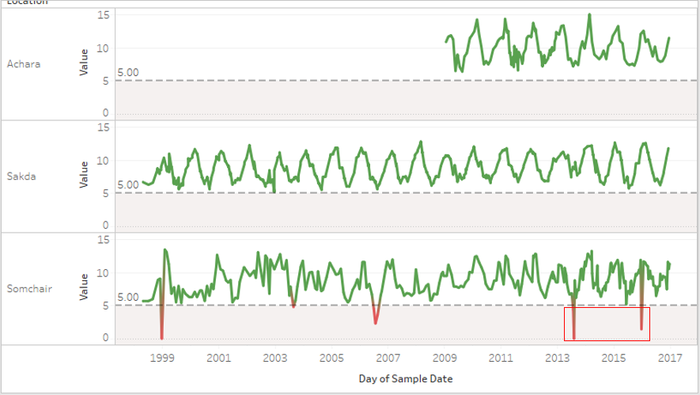
Let’s have a look at stream 2 (Somchair,Achara,Sakda)
Achara and sakda don’t have any anomalies while Somchair has had drop in DO levels in the recent years.
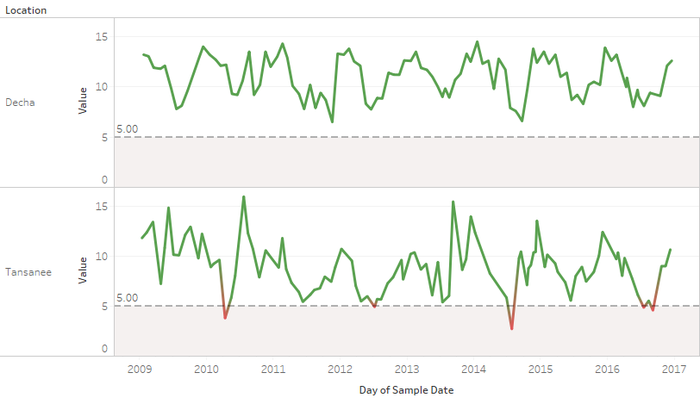
Looking at stream 3(Tansanee) & 4(Decha) indicate no alarming trends in DO.
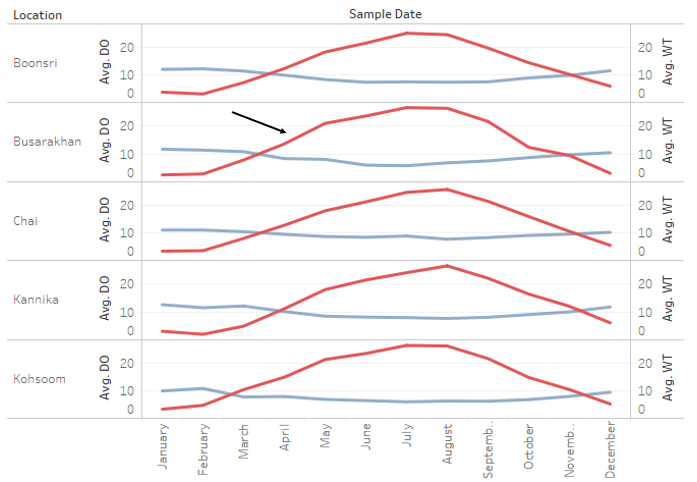
Also, An interesting relationship is observed between Water temperature and DO levels.
In the below visualisation, a dual axis chart is created for Average monthly Dissolved Oxygen level and Water temperature over the last 5 years. It is clearly seen that an inverse relationship exists between the 2 parameters.
For example, this relationship is studied for all locations in the stream 1 and it is seen that the trend is similar across all regions. Greater the area between the two lines, greater the effect on aquatic life as pointed out by the black arrow at Busarakhan.

