Difference between revisions of "ISSS608 2017-18 T3 Assign VISHALI REDDY NALLA - Insights"
| Line 49: | Line 49: | ||
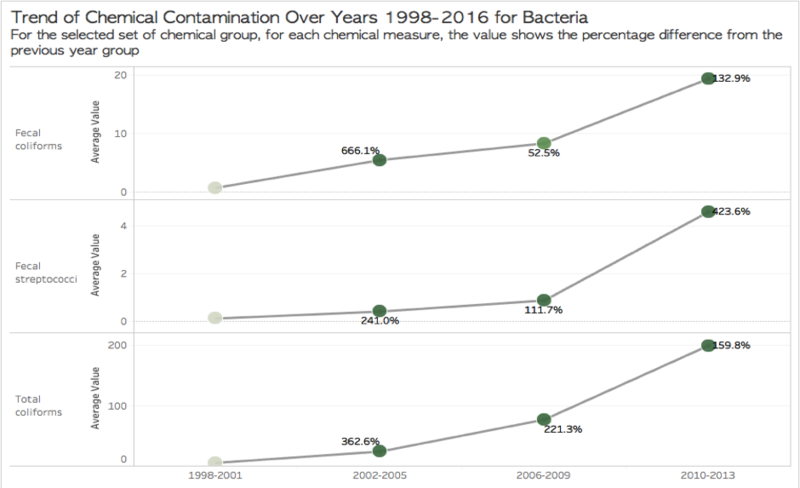
• The trend line for all measures in Bacteria has been increasing over years, but the data is present only till 2013, therefore we don’t have readings for recent years. | • The trend line for all measures in Bacteria has been increasing over years, but the data is present only till 2013, therefore we don’t have readings for recent years. | ||
| + | |||
| + | [[Image:Insights Vi1.png|800px]] | ||
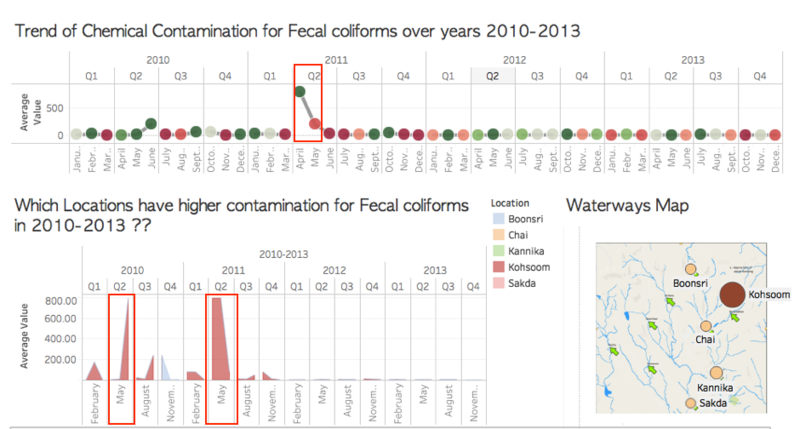
• When drilled down for years 2010-2013, a major spike is seen in Q2 for Fecal Coliforms in Kohsoom. Consistent readings were taken only in Kohsoom in Boonsri. | • When drilled down for years 2010-2013, a major spike is seen in Q2 for Fecal Coliforms in Kohsoom. Consistent readings were taken only in Kohsoom in Boonsri. | ||
• Overall, The 3 measures in Bacteria show an increasing trend over years and has the highest value in Kohsoom as compated to Boonsri. There are hardly any readings taken for other locations. | • Overall, The 3 measures in Bacteria show an increasing trend over years and has the highest value in Kohsoom as compated to Boonsri. There are hardly any readings taken for other locations. | ||
| + | |||
| + | [[Image:Insights Vi2.png|800px]] | ||
<b> 2) Field Measurements </b> | <b> 2) Field Measurements </b> | ||
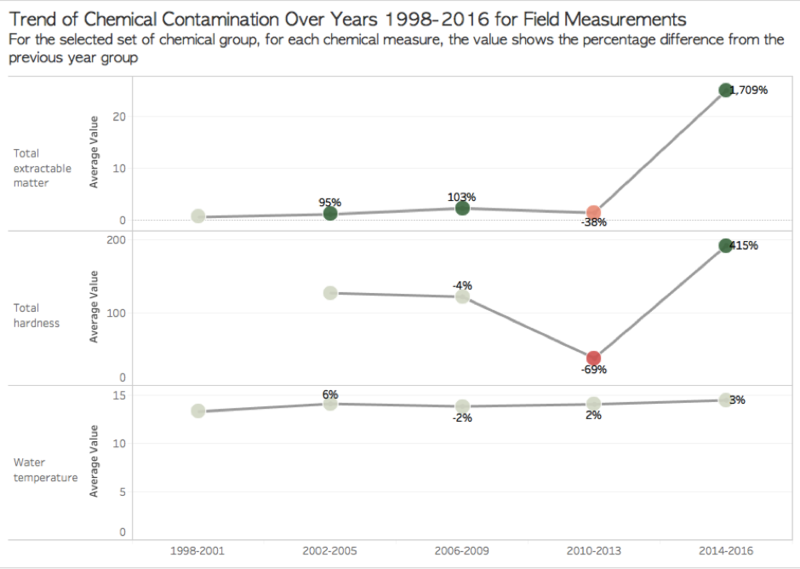
• Total extractable matter and Total hardness has a huge increase in average value in 2014-2016 whereas Water Temperature remains constant. | • Total extractable matter and Total hardness has a huge increase in average value in 2014-2016 whereas Water Temperature remains constant. | ||
| + | |||
| + | [[Image:Insights Vi3.png|800px]] | ||
• Total Hardness is high in most of the regions except for Achara. | • Total Hardness is high in most of the regions except for Achara. | ||
| + | |||
| + | [[Image:Insights Vi4.png|800px]] | ||
• Only 1 reading is taken for Total extractable matter in Q3 2014 in Kannika & Sakda which shows increase in average value. Due to insufficient data, we cannot analyze the increase in value for other locations. | • Only 1 reading is taken for Total extractable matter in Q3 2014 in Kannika & Sakda which shows increase in average value. Due to insufficient data, we cannot analyze the increase in value for other locations. | ||
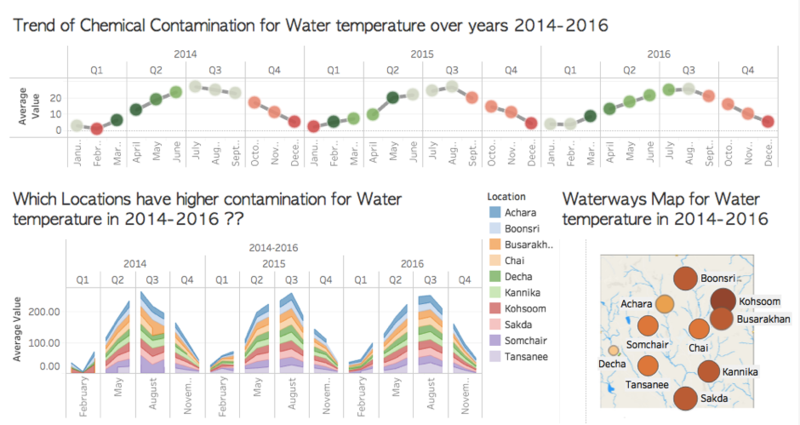
• Water Temperature shows a cyclic pattern in years 2014-2016 and there were sufficient recordings taken for Water Temperature with good frequency. Overall, the water temperatures are very low in Decha. | • Water Temperature shows a cyclic pattern in years 2014-2016 and there were sufficient recordings taken for Water Temperature with good frequency. Overall, the water temperatures are very low in Decha. | ||
| + | |||
| + | [[Image:Insights Vi5.png|800px]] | ||
<b> 3) Hydrocarbons </b> | <b> 3) Hydrocarbons </b> | ||
| Line 72: | Line 82: | ||
• Interestingly for Petroleum Hydrocarbons average value has decreased by 95% in 2014-2016 and it has sufficient readings. | • Interestingly for Petroleum Hydrocarbons average value has decreased by 95% in 2014-2016 and it has sufficient readings. | ||
| + | [[Image:Insights Vi7.png|800px]] | ||
<b> 4) Metals </b> | <b> 4) Metals </b> | ||
| Line 80: | Line 91: | ||
• Not sufficient readings for Barium, Berilium, Boron & Cesium to analyze the trend. | • Not sufficient readings for Barium, Berilium, Boron & Cesium to analyze the trend. | ||
| + | |||
| + | [[Image:Insights Vi9.png|800px]] | ||
<b> 5) Organic </b> | <b> 5) Organic </b> | ||
| Line 88: | Line 101: | ||
• For AOX, readings are taken only in Boonsri and Kohsoom in 2016 only. | • For AOX, readings are taken only in Boonsri and Kohsoom in 2016 only. | ||
| + | |||
| + | [[Image:Insights Vi10.png|800px]] | ||
<b> 6) Salts </b> | <b> 6) Salts </b> | ||
| Line 96: | Line 111: | ||
• Not sufficient readings for carbonates, chlorodinine, sulphides and total dissolved phosphorous. | • Not sufficient readings for carbonates, chlorodinine, sulphides and total dissolved phosphorous. | ||
| + | |||
| + | [[Image:Insights Vi13.png|800px]] | ||
<b> 7) Chloro </b> | <b> 7) Chloro </b> | ||
| Line 101: | Line 118: | ||
• In this group of chemicals, Except for gamma-hexachlorocyclohexane, other chemical measures don’t have readings almost after 2011. Only gamma-hexachlorocyclohexane has proper readings over years and it shows almost a constant trend in 2014-2016 | • In this group of chemicals, Except for gamma-hexachlorocyclohexane, other chemical measures don’t have readings almost after 2011. Only gamma-hexachlorocyclohexane has proper readings over years and it shows almost a constant trend in 2014-2016 | ||
| + | [[Image:Insights Vi15.png|800px]] | ||
Revision as of 15:13, 8 July 2018
|
|
|
|
|
|
| CONTENT |
|---|
1.
1) Bacteria
• The trend line for all measures in Bacteria has been increasing over years, but the data is present only till 2013, therefore we don’t have readings for recent years.
• When drilled down for years 2010-2013, a major spike is seen in Q2 for Fecal Coliforms in Kohsoom. Consistent readings were taken only in Kohsoom in Boonsri.
• Overall, The 3 measures in Bacteria show an increasing trend over years and has the highest value in Kohsoom as compated to Boonsri. There are hardly any readings taken for other locations.
2) Field Measurements
• Total extractable matter and Total hardness has a huge increase in average value in 2014-2016 whereas Water Temperature remains constant.
• Total Hardness is high in most of the regions except for Achara.
• Only 1 reading is taken for Total extractable matter in Q3 2014 in Kannika & Sakda which shows increase in average value. Due to insufficient data, we cannot analyze the increase in value for other locations.
• Water Temperature shows a cyclic pattern in years 2014-2016 and there were sufficient recordings taken for Water Temperature with good frequency. Overall, the water temperatures are very low in Decha.
3) Hydrocarbons
• All the Bonzo group chemicals show an increasing trend in 2006-2009 and no readings were taken after that period.
• Other chemicals in groups have very few readings taken and almost no readings taken in recent years. The graph below shows number of records for all hydrocarbons from 1998-2016 excluding Petroleum Hydrocarbon.
• Interestingly for Petroleum Hydrocarbons average value has decreased by 95% in 2014-2016 and it has sufficient readings.
4) Metals
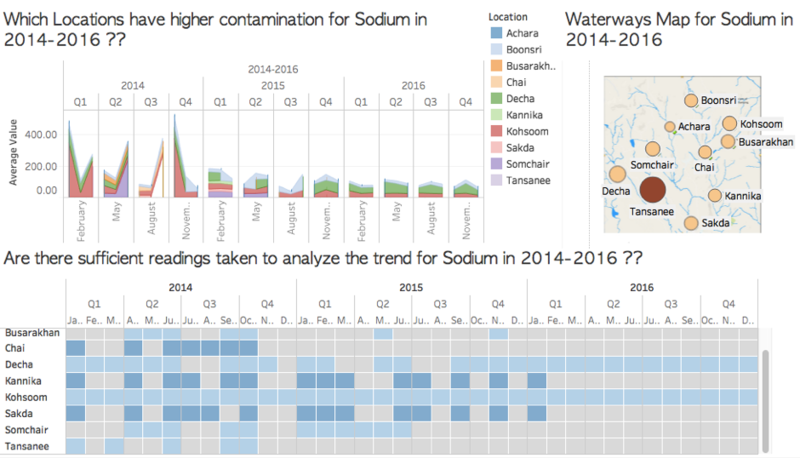
• Calcium, Magnesium , Potassium show a constant trend whereas Sodium average value has increased by 22%
• For Sodium, values are high in 2014 mainly in Tansanee after which the average value is decreased. But, there were not sufficient readings taken in years 2015-2016 for Busarakhan, Chai, Kannika, Sakda, Somchair & Tansanee to analyze the trend.
• Not sufficient readings for Barium, Berilium, Boron & Cesium to analyze the trend.
5) Organic
• For most of the chemicals, there is no data for the years 2014-2016. For other chemicals which showed value for 2014-2016, when drilled down to year and month, very less readings are seen.
• AOX value has decreased by 24% in recent years but there is also missing data for years 2014 and 2015, similarly Organic Nitrogen shows a decrease in 108% but when drilled down, there is only one reading taken in 3 years. Therefore, we cannot analyze the trend for these chemicals.
• For AOX, readings are taken only in Boonsri and Kohsoom in 2016 only.
6) Salts
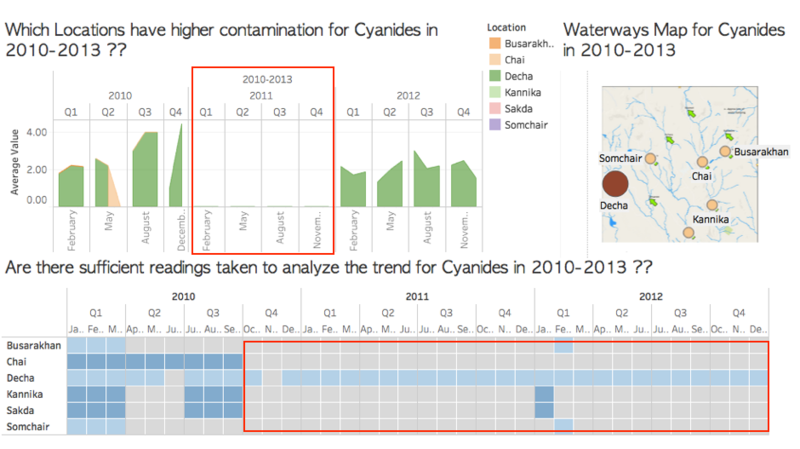
• Cyanides show a very high increase in years 2010-13 but there are no readings taken after that. In particular most of the readings are taken in Decha only after Q4 2010, so nothing can be stated regarding the cyanides in other places.
• Chemicals which have constant trend with readings taken regularly are – Ammonium, Bicarbonates, Sulphates and Total Dissolved Salts.
• Not sufficient readings for carbonates, chlorodinine, sulphides and total dissolved phosphorous.
7) Chloro
• In this group of chemicals, Except for gamma-hexachlorocyclohexane, other chemical measures don’t have readings almost after 2011. Only gamma-hexachlorocyclohexane has proper readings over years and it shows almost a constant trend in 2014-2016

