Difference between revisions of "ISSS608 2017-18 T3 Assign Vaishnavi Praveen Agarwal Visual"
Jump to navigation
Jump to search
| Line 37: | Line 37: | ||
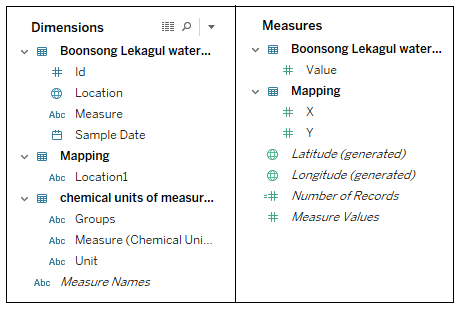
The finals dataset contains various columns and the columns are divided into Dimensions and Measures in Tableau based on their properties. Before starting with the Visualization, lets get familiar with the available Dimensions and Measures. | The finals dataset contains various columns and the columns are divided into Dimensions and Measures in Tableau based on their properties. Before starting with the Visualization, lets get familiar with the available Dimensions and Measures. | ||
| − | <span style=text-align:center;">[[Image:Vaishnavi_8.png|700px|thumb| | + | <span style=text-align:center;">[[Image:Vaishnavi_8.png|700px|thumb|left]]</span> |
Revision as of 20:03, 7 July 2018
|
|
|
|
|
|
|
Dimensions and Measures
The finals dataset contains various columns and the columns are divided into Dimensions and Measures in Tableau based on their properties. Before starting with the Visualization, lets get familiar with the available Dimensions and Measures.

