Difference between revisions of "ISSS608 2017-18 T3 Assign Kaushik Jaganathan - Methodology and Design"
Jump to navigation
Jump to search
| Line 67: | Line 67: | ||
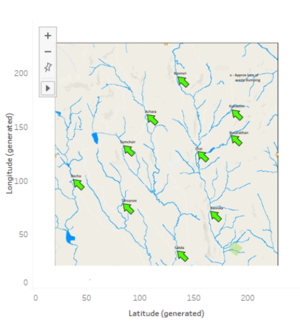
The Waterways Final is a map image that shows the location of dumping site and the waterways. | The Waterways Final is a map image that shows the location of dumping site and the waterways. | ||
| − | <span style=text-align:center;">[[Image: | + | <span style=text-align:center;">[[Image:water_crop.jpg|200px|thumb|left]]</span> |
|} | |} | ||
Revision as of 19:06, 7 July 2018
ISSS608 2017-18 Mini Challenge 2 - Kaushik Jaganathan
|
|
|
|
|
Data description & preparation
|
File Name |
Variables |
|
Boonsong Lekagul waterways readings (.csv file) |
The given data file has reading of 106 chemicals at 10 different locations from 1998 - 2016. i. id (numeric , unique)
|
|
chemical units of measure (.csv file) |
The given data file has the unit of each measure (106 measures) in which the readings were taken. i. measure (string, unique)
|
|
Waterways Final (.jpg file) |
The Waterways Final is a map image that shows the location of dumping site and the waterways. File:Water crop.jpg 200px |
|
Steps |
Image |
|
Adding Data and Background Image
|
|
|
Annote Point
|
|
