Difference between revisions of "Group20 Report"
| Line 28: | Line 28: | ||
|} | |} | ||
| + | |||
| + | |||
| + | <!--OVERVIEW CONTENT --> | ||
| + | ==Introduction and Motivation== | ||
| + | |||
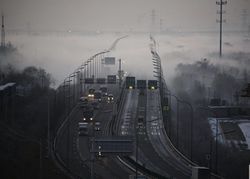
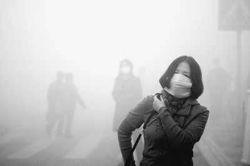
| + | In the winter of 2014, Beijing suffered severe smog weather. The haze has lasted for half a year, and the number of heavy polluted days was more than one month. Air quality issues and environment issues were being discussed throughout the country, everyone was questioning himself about the consequences of developing economy by sacrificing environment. Our living conditions has become bad, and we are faced with the tracheitis, pneumoconiosis, asthma, to name just a few. | ||
| + | |||
| + | [[File:Group20_100.jpg|250px]][[File:Group20_101.jpg|250px]] | ||
| + | |||
| + | Chinese government has frequently proposed to abandon the outdated idea called “treatment after pollution” and to protect the environment while developing the economy. Therefore, after three years, has China’s air quality become better? | ||
| + | In our project, we want to apply the visual analytics tools to visualize the changes of air quality of major cities of China. We will show the fluctuation of the historical AQI (Air Quality Index), and the pollution sources, like PM2.5, PM10, SO2, O3, CO2 and so on. | ||
| + | |||
| + | ==Review and critique on past work== | ||
| + | |||
| + | As increasing people are attaching more importance to environment issues, there are a lot of researchers over the world studying how to improve our environment, including air quality problem, and they have contributed many substantial outcomes to this area. In China, researchers have studied air quality from various aspects based on the background of China. Some of them focused on impact of human factors on air quality, such as increasement of population and GDP, some of them focused on specific areas, like Beijing, Shanghai or eastern areas, to analyze that how the air quality is changing, and others are also interested in forecasting air quality in the future. As experts have already enriched this research area, we will focus on using visualization tools to help people better and more effectively understand the changing trend of air quality and its pollution sources. We hope that we can give some contribution raising awareness of protecting environment of people. | ||
| + | |||
| + | ==Project Timeline== | ||
| + | |||
| + | {| class="wikitable sortable" | ||
| + | |- | ||
| + | ! Task(s) !! Week | ||
| + | |- | ||
| + | | Confirmation of topic, data-set and proposal || 7 | ||
| + | |- | ||
| + | | Email consultation with Prof Kam for feedback on proposal || 8 (18 Jun) | ||
| + | |- | ||
| + | | Sketch out visual analytics solution || 9 | ||
| + | |- | ||
| + | | F2F consultation with Prof Kam for feedback on sketch || 10 | ||
| + | |- | ||
| + | | Implementation of visual analytics solution using Tableau/R|| 11 | ||
| + | |- | ||
| + | | F2F consultation with Prof Kam for feedback on progress/obstacles || 12 | ||
| + | |- | ||
| + | | Finalize the wiki report and poster || 13 | ||
| + | |- | ||
| + | | Poster presentation cum conference || 14 (14 Aug) | ||
| + | |} | ||
| + | |||
| + | ==Visualization Approach== | ||
| + | <br /> | ||
| + | * '''[[Our visualization will base on R Shiny and we will do the time series analysis and forecasting by using historical data to estimate air quality index in future.]]''' | ||
| + | |||
| + | |||
| + | * '''[[We will conduct interactive geographic analysis to discover what factor influences the AQI such as number of cars, forest cover rate, GDP.]]''' | ||
| + | |||
| + | |||
| + | * '''[[In addition, we will explore whether the first-tier city only pursue high GDP and leave alone the air quality then trigger respiratory disease]]''' | ||
| + | |||
| + | ==Data Source== | ||
| + | All these first-tier city AQI and responding date and some index contribute to API(PM2.5,PM10,SO2,CO,NO2,O3)(2014-2017).<br /> | ||
| + | GDP in those first tier city from 2014-2017.<br /> | ||
| + | Forest cover rate in the province of those cities.<br /> | ||
| + | Car number in those cities(2016-2017).<br /> | ||
| + | Total factory numbers in those cities.<br /> | ||
| + | Respiratory disease.<br /> | ||
| + | |||
| + | http://data.stats.gov.cn/easyquery.htm?cn=E0103<br /> | ||
| + | https://www.aqistudy.cn/historydata/<br /> | ||
| + | http://www.sc.stats.gov.cn/tjcbw/tjnj/2017/zk/indexch.ht<br /> | ||
| + | http://www.stats-hb.gov.cn/<br /> | ||
| + | http://www.bjstats.gov.cn/tjsj/<br /> | ||
| + | http://www.gzstats.gov.cn/tjsj/hgjjsjk/<br /> | ||
| + | http://www.gdstats.gov.cn/tjsj/zh/<br /> | ||
| + | http://tjj.zj.gov.cn/tjsj/ydsj/gy/<br /> | ||
| + | http://www.njtj.gov.cn/<br /> | ||
| + | http://www.cqtj.gov.cn/tjsj/sjjd/<br /> | ||
| + | http://stats.tj.gov.cn/<br /> | ||
| + | http://tj.jiangsu.gov.cn/<br /> | ||
| + | http://www.shaanxitj.gov.cn/<br /> | ||
| + | http://www.hntj.gov.cn/<br /> | ||
| + | http://www.ln.stats.gov.cn/<br /> | ||
| + | http://www.stats-sd.gov.cn/<br /> | ||
| + | http://www.ha.stats.gov.cn | ||
Revision as of 16:22, 13 August 2018
|
|
|
|
|
|
Contents
Introduction and Motivation
In the winter of 2014, Beijing suffered severe smog weather. The haze has lasted for half a year, and the number of heavy polluted days was more than one month. Air quality issues and environment issues were being discussed throughout the country, everyone was questioning himself about the consequences of developing economy by sacrificing environment. Our living conditions has become bad, and we are faced with the tracheitis, pneumoconiosis, asthma, to name just a few.
Chinese government has frequently proposed to abandon the outdated idea called “treatment after pollution” and to protect the environment while developing the economy. Therefore, after three years, has China’s air quality become better? In our project, we want to apply the visual analytics tools to visualize the changes of air quality of major cities of China. We will show the fluctuation of the historical AQI (Air Quality Index), and the pollution sources, like PM2.5, PM10, SO2, O3, CO2 and so on.
Review and critique on past work
As increasing people are attaching more importance to environment issues, there are a lot of researchers over the world studying how to improve our environment, including air quality problem, and they have contributed many substantial outcomes to this area. In China, researchers have studied air quality from various aspects based on the background of China. Some of them focused on impact of human factors on air quality, such as increasement of population and GDP, some of them focused on specific areas, like Beijing, Shanghai or eastern areas, to analyze that how the air quality is changing, and others are also interested in forecasting air quality in the future. As experts have already enriched this research area, we will focus on using visualization tools to help people better and more effectively understand the changing trend of air quality and its pollution sources. We hope that we can give some contribution raising awareness of protecting environment of people.
Project Timeline
| Task(s) | Week |
|---|---|
| Confirmation of topic, data-set and proposal | 7 |
| Email consultation with Prof Kam for feedback on proposal | 8 (18 Jun) |
| Sketch out visual analytics solution | 9 |
| F2F consultation with Prof Kam for feedback on sketch | 10 |
| Implementation of visual analytics solution using Tableau/R | 11 |
| F2F consultation with Prof Kam for feedback on progress/obstacles | 12 |
| Finalize the wiki report and poster | 13 |
| Poster presentation cum conference | 14 (14 Aug) |
Visualization Approach
Data Source
All these first-tier city AQI and responding date and some index contribute to API(PM2.5,PM10,SO2,CO,NO2,O3)(2014-2017).
GDP in those first tier city from 2014-2017.
Forest cover rate in the province of those cities.
Car number in those cities(2016-2017).
Total factory numbers in those cities.
Respiratory disease.
http://data.stats.gov.cn/easyquery.htm?cn=E0103
https://www.aqistudy.cn/historydata/
http://www.sc.stats.gov.cn/tjcbw/tjnj/2017/zk/indexch.ht
http://www.stats-hb.gov.cn/
http://www.bjstats.gov.cn/tjsj/
http://www.gzstats.gov.cn/tjsj/hgjjsjk/
http://www.gdstats.gov.cn/tjsj/zh/
http://tjj.zj.gov.cn/tjsj/ydsj/gy/
http://www.njtj.gov.cn/
http://www.cqtj.gov.cn/tjsj/sjjd/
http://stats.tj.gov.cn/
http://tj.jiangsu.gov.cn/
http://www.shaanxitj.gov.cn/
http://www.hntj.gov.cn/
http://www.ln.stats.gov.cn/
http://www.stats-sd.gov.cn/
http://www.ha.stats.gov.cn


