Difference between revisions of "ISSS608 2017 T3 Assign BI HE Question&Dashboard"
He.bi.2017 (talk | contribs) |
He.bi.2017 (talk | contribs) |
||
| Line 38: | Line 38: | ||
=Dashboard= | =Dashboard= | ||
| + | |||
| + | |||
| + | <table width=90%> | ||
| + | <tr> | ||
| + | <td> | ||
| + | [[File:Bh55.PNG|500 px|left]]</td> | ||
| + | |||
| + | </tr> | ||
| + | </table> | ||
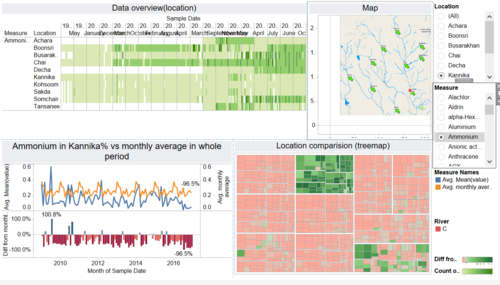
| + | [https://public.tableau.com/trusted/xgxZ1WwbQR25_tbqWy2wTg==:ZsAViNpXXV-bjnPdD-XHzdot?:redirUrl=%2Fprofile%2Fapi%2Fpublish%2FMC2_1_1%2FDashboard1 Dashboard link] | ||
Revision as of 11:48, 10 July 2018
|
|
|
|
|
|
Q3 After reviewing the data, do any of your findings cause particular concern for the Pipit or other wildlife? Would you suggest any changes in the sampling strategy to better understand the waterways situation in the Preserve?
The waterway data show a worrying water condition in the preserve. It will not only cause the decrease of pipit number, but also put negative impacts on aquatic animals.
Strategy
Confluence such as Chai connected rivers flowed out from Boonsri, Busarakhan and Kohsoom. So, it may be more efficient and economical to put more sensors in this kind of river confluence spot. Each sensor should target a specific GPS location. When detecting the water samples, each sensor should return chemistry values also the location values. Thus, people can decide where the pollution sources are. and find out the source in upstream areas.
