|
|
| Line 41: |
Line 41: |
| | <br/>From the example below, which shows records of location Kohsoom in year 2015, we could see that contaminants AGOC-3A, Chlorodinine, Methylosmoline are always sampled in a different time as other measures, depicting a discrepancy among other measures but maintain similar interval. Thus, these three measures remain further exploration for correlation or practical interaction. | | <br/>From the example below, which shows records of location Kohsoom in year 2015, we could see that contaminants AGOC-3A, Chlorodinine, Methylosmoline are always sampled in a different time as other measures, depicting a discrepancy among other measures but maintain similar interval. Thus, these three measures remain further exploration for correlation or practical interaction. |
| | </td> | | </td> |
| − | <td>[[image:lyr5.jpg|600px|center]]</td> | + | <td>[[image:lyr5.jpg|550px|center]]</td> |
| | </tr> | | </tr> |
| | | | |
Revision as of 17:58, 9 July 2018
 VAST Challenge 2018 Mini-Challenge 2:Like a Duck to Water
Tableau Dashboard Demo
Please refer to this link for more dynamic exploration:
Tableau Dashboard
Preliminary Analysis
Q1: Characterize the past and most recent situation with respect to chemical contamination in the Boonsong Lekagul waterways. Do you see any trends of possible interest in this investigation?
| Analysis |
Visualization |
| 1. Inconsistent Sampling among Measures”
By lining up all the measures for each location at certain period time, we could see the sampling missing pattern for from several dimension. In the sampling detail matrix, one line indicates a single week, horizontally we could see how frequently a measure is recorded in a year and compare the measures sampling time, vertically we could find the measures are recorded within a particular week.
From the example below, which shows records of location Kohsoom in year 2015, we could see that contaminants AGOC-3A, Chlorodinine, Methylosmoline are always sampled in a different time as other measures, depicting a discrepancy among other measures but maintain similar interval. Thus, these three measures remain further exploration for correlation or practical interaction.
|
|
| 2. Measures with Same Sampling Pattern”
Mentioned by scholar that Methylosmoline is the confirmed contaminant in the waste from light manufacture, so we start with this measure to explore more related changes. From the record frequency gantt chart, we could see the irregular sampling interval through all the years and locations, in some years, many records are noted down whereas there are frequent wide gap appeared between two sampling date in other years. Regarding to Methylosmoline, location Achara, Decha, Tansanee do not take such sample, for those sampled location, this chemical had only been measured from year 2014 onwards. Interestingly, early mentioned suspect correlated measures Chlorodinine, AGOC-3A show identical record frequency patterns as Methylosmoline, meaning that these three chemicals are sampled together under certain condition.
|
|
| 3.Methylosmoline Overall Trend
We now focus on contaminant Methylosmoline to view the pollutant situation across all the sampled location by year. Overall, at the start of sampling, there are indifferent concentration in Methylomsmoline for all the location, which could view as a normal status without dumping from the manufacture.
Right from end of year 2014, different streams began to show diverging trend with a rocket increasing concentration in Somchair, Kohsoom, Chai, while other location remains the same level as previous time. Those sites with stable trend all experienced a sharp dropdown at the end of year 2015, and all drop to around 0.02 mg/L of Methylosmoline, since they are in the same stream system, the most reasonable reason caused drops is the environment. In terms of the macro impact from environment, there should be more or less impact to other stream regardless of the location, since impacted stream have no hierarchical networks among each other. Thus Somchair, Kohsoom and Chai are the most suspect candidate dumping sites, and more justification from other measures and pattern analysis need to be done to investigate deeper.
|
|
| 4.Correlation Exploring
According to unfold measures, we implement multivariate analysis for contaminant Methylosmoline to dig deeper to see any related measures. Here are selected measures with relative high correlation (>0.6) with Methylosmoline, and AGOC-3A, Chlorodinine respectively. The matrix shows that suspect measures hardly have correlation with Methylosmoline. For other measures, although the pairwise value is quite high, but it is very conservative due to large missing value pattern, meaning too little matching record could be paired to evaluate correlation.
The scatterplot matrix shows poor correlated patterns for almost each measure, but undeniably some points appear strong correlation, so we should map these measures into tableau to compare the trend with Methylosmoline geographically.
|
|
| 5.Correlated Measures Illustration
By lining up all the correlated measures versus Methylosmoline and setting an exponential trend line, we find that Dissolved silicates who possess the highest positive correlation with Methylosmoline appears poor correlated scatterplot and trend on a detailed level. Surprisingly, chemicals Chemical Oxygen Demand (Cr) and Anionic active surfactants share specific similar trend for location Kohsoom, but less identical patterns for other Methylosmoline value upwards location. In this way, site Kohsoom have more mystery to explore and the practical relevance between Methylosmoline and Anionic active surfactants, Chemical Oxygen Demand (Cr) require more field and lab research.
|
|
Anomaly Discovery
Q2: What anomalies do you find in the waterway samples dataset? How do these affect your analysis of potential problems to the environment? Is the Hydrology Department collecting sufficient data to understand the comprehensive situation across the Preserve?
| Analysis |
Visualization |
| 1.Detailed Investigation at Daily Record
From the preliminenary analysis, we include Somchair, Kohsoom and Chai into suspect dumping site list, also we discover a stepped growth in Methylosmoline concentration in sites Somchair and Chai, which is worth exploring into more detailed sampling date. The daily record in these three sites provide some evidence for uncontrollable factor while assessing the dumping site:
Chai is the most modest growing member from 0.3mg/L to 5mg/L then dropping to 1mg/L, showing a very rhythmic patterns within a day. Since there are multiple sampling within a day showing different value at different time, the plot of Chai provides a view of impact from time. At the end of year 2015, the daily maximum value of Chai suddenly zoomed up to 4.3mg/L while the daily minimum value appears milder upwards trend and maintain at about 1.5mg/L. In this way, Chai is less suspect due to regular and consistent hourly variance. Moreover, the sudden increase is worth investigating since Chai is the main stream for another suspect tributary -Kohsoom.
Somchair also shows a stepped growing trend: two sudden rocket turning point followed by onwards stable level in Methylosmoline concentration. However, it is very inconclusive to criticize Somchair as dumping point due to consistent polluting. So Pattern analysis should be introduced to compare the polluting patterns in both Somchair and Kohsoom.
|
|
| 2.Stream Path Analysis
Based on the map, the Kohsoom is a tributary of Chai, which belongs to Kannika stream system, and Somchair belongs to main stream Skada. For Skada water system, there are another sampling sites Achara, but this site did not record the measure Methylosmoline, thus it is more difficult and limited to conduct path pattern analysis. In this way, we mainly focus on Chai water system.
The red reference line represents value of Chai main stream and blue and grey bars represent two tributaries, Kohsoom and Boonsri respectively. From the graph we could see that Boonsri seldom contributes Methylosmoline to Chai, and the Methylosmoline concentration of Kohsoom shows slightly discrepancy with that of Chai. At the initial growth phase, concentration in Chai is higher than Kohsoom, as dramatic increase in Kohsoom, Chai surprisingly shows a contrast downwards trend and the dynamic growing concentration from Kohsoom did not affect the stable level maintained in Chai. Practically, the concentration is affected by multiple factors rather than a single steam content, thus further analysis rather than hydrological sampling should be included to collect other dimensions of each tributary. By comparing the tributary and main stream in Chai water system, what we could further infer is that Chai is not the dumping site with untouched concentration while tributary carrying high toxic chemical concentration.
|
|
| 3.Anionic active surfactants Related Analysis
To further compare site Somchair and Kohsoom, we resort to other measures to discover difference between them. Earlier mentioned measures Anionic active surfactants and Chemical Oxygen Demand (Cr), which show similar trends with Methylosmoline in some sites to help evaluate pollutant status.
For measure Anionic active surfactants, which is popular in industry to be used for wastewater sedimentation, it appears an identical trend to Methylosmoline in Kohsoom, while Somchair did not monitor such index. Specifically, Anionic active surfactants also started to increase from year 2015 onwards, and according to standards, when such measure reach 1mg/L, the water would be severely polluted, although such chemicals is intended to purify the industrial wastewater. There is significant implication that the manufacture tends to increase the concentration of Anionic active surfactants to enhance sedimentation while they dumping more pollutants into river.
|
|
| 4.Chemical Oxygen Demand Related Analysis - Locating the suspect dumping site
For measure Chemical Oxygen Demand (Cr), which is used to quantify amount of oxidizable pollutants found in surface water, higher meaning severer pollution. From the pair graph, we could see that at year 2014, Kohsoom and Somchair shared same level in both Methylosmoline and Chemical Oxygen Demand (Cr). However, when it comes to year 2015, COD in Kohsoom increased sharply and whole concentration level is lifted by about 10 units, while COD in Somchair still maintain a stable level as year 2014 despite some abnormal increase.
In this way, Kohsoom shows more evidence to be the suspected dumping site of the Kasios Furniture Company. Nonetheless, the stepped growth pattern in Somchair should be investigated as well by introducing daily multiple sampling and other sampling of different environment subject.
|
|
Sampling Strategy
Q3: Would you suggest any changes in the sampling strategy to better understand the waterways situation in the Preserve?
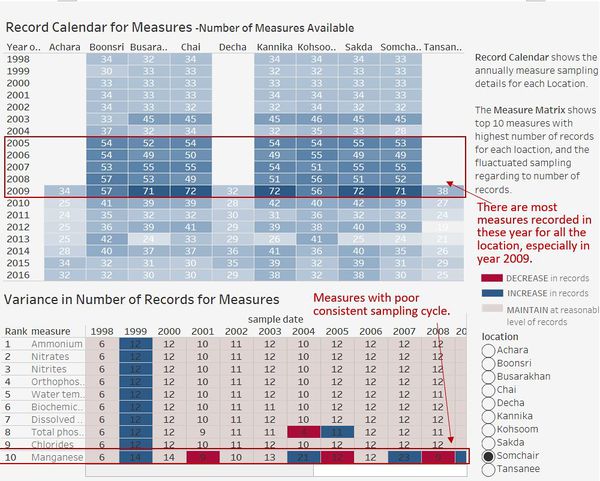
As for scientific research, the sampling datetime, method and measures should be standardized for more robust comparison. Regarding to sampling interval and cycle, existing records show irregular number of records and sampling interval. The varying number of measures in each year suggests that some measures are no longer to be noted and some new measures are introduced into monitor list.
Suggestion: Unifying the measures category and systemized the sampling date and period throughout the whole years. By industrialized the sampling and monitoring process, more data would be available for comparison both horizontally and vertically, and having no-discrepancy data is essential to clustering similar measures or conduct PCA to reduce dimension to better evaluate the water quality.
The sample records should also mark down the sampling time to provide hourly information for researcher. Meanwhile it is highly recommended to introduce daily multiple sampling method at maximum effort to better understand the variance impacted from time, temperature and others environment factor.
Other water dimension should be available as well. In stream path analysis, it is reasonable to conclude that the mainstream maintain more stable and lower level of chemicals concentration, but the speed and flow of both upstream and downstream should be considered to assess the reasonable decrease level in the mainstream, since the company may dumping in one sites, and pouring large amount of chemical purifier at the downstream, which is actually the secondary damage.
Field sample from other environment department should be included into research as well, for instance, soil analysis and air analysis. Some area may have characteristic geographical feature which should be considered while comparing to other area, thus recording the variance rather than absolute figure may be a better choice for some special areas.
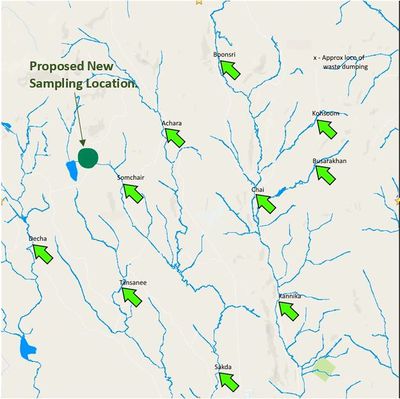
- Proposed New Sampling Location
Given the present available data, here is the suggested new sampling location, which locates at the downstream of a lake and contribute to the suspect dumping site Somchair. By sampling the water here and comparing to the Somchair, it would be much easier to find the anomaly in Somchair – Why the Methylosmoline concentration keeps increasing and maintain stable? is it due to regular dumping at site or the upstream contribution or the irreversible environment changes.
Moreover, there are only one more tributary flowing into Somchair, so there would be less disturb and noise to compare the upstream and downstream in Somchair. Additionally, the proposed sampling location is right below a lake, where our treasury pipit and other wildlife are alive, so to monitor the water there would help assess the environment which directly related to the wildlife homeland.
 VAST Challenge 2018 Mini-Challenge 2:Like a Duck to Water


