Difference between revisions of "ISSS608 2017-18 T3 Assign Harisingh Q3"
| Line 40: | Line 40: | ||
[[File:h_chart23.png||700px]] | [[File:h_chart23.png||700px]] | ||
| + | |||
| + | |||
| + | Lastly, '''Methylosmolene''' also observed very unconventional peak during August, 2016 in Kohsoom. | ||
| + | |||
| + | [[File:h_chart24.png||700px]] | ||
Latest revision as of 05:10, 9 July 2018
For last part of analysis, I have focused more on chemicals which are toxic in nature. The changes in these chemicals can ultimately harm the preserve wildlife.
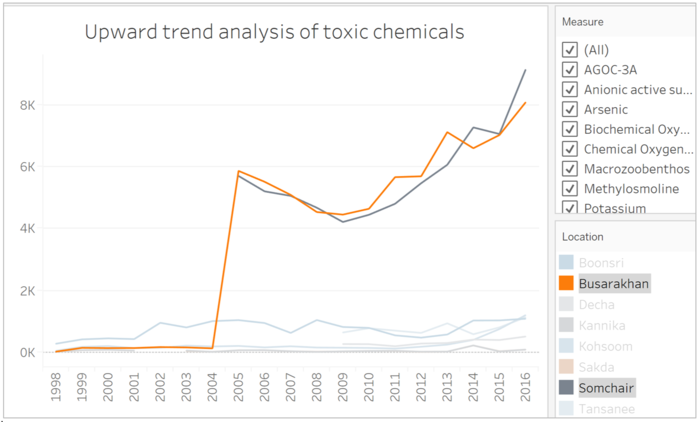
In Busarakhan and Somchair, the concentration of ALL toxic chemicals has followed an upward trend since 2009 onward. While discussing chemical-wise distribution for Q1, we found out that these locations seem to have Geo-spatial relationship in terms of changes in chemical concentration.
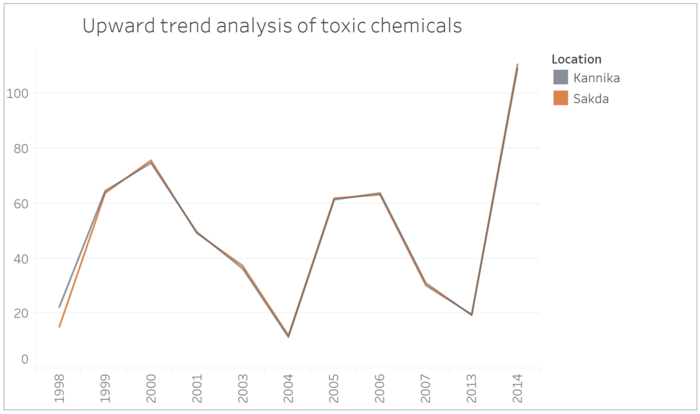
In case of Macrozoobenthos, the changes observed in readings follow same trend in Kannika and Sakda. In chemical wise distribution analysis for Q1, we observed that most of the chemicals follow similar trends in both Kannika and Sakda locations. As I highlighted in earlier sections, investigators can use this information to further understand Geo-spatial relationship among different sites.
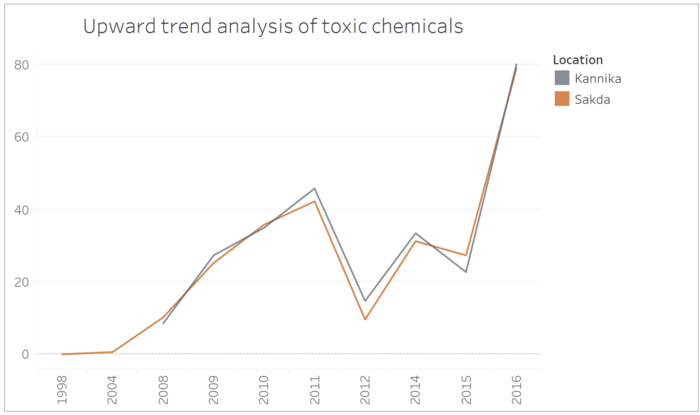
Arsenic seem to experience an abrupt increase in its readings in recent years, 2014 onward. Looking at past pattern, the increase in readings looks very unconventional for Arsenic.
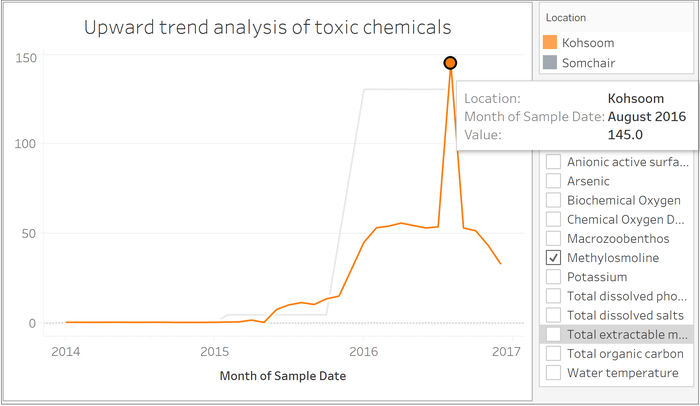
Lastly, Methylosmolene also observed very unconventional peak during August, 2016 in Kohsoom.


