Difference between revisions of "ISSS608 2017-18 T3 Assign VISHALI REDDY NALLA - Data Preparation"
| (2 intermediate revisions by the same user not shown) | |||
| Line 6: | Line 6: | ||
{|style="background-color:#F7E7D4;" width="100%" cellspacing="0" cellpadding="0" valign="top" border="0" | | {|style="background-color:#F7E7D4;" width="100%" cellspacing="0" cellpadding="0" valign="top" border="0" | | ||
| − | | style="font-family:Georgia; font-size:100%; solid #343009; background:#F7E7D4; text-align:center;" width=" | + | | style="font-family:Georgia; font-size:100%; solid #343009; background:#F7E7D4; text-align:center;" width="16%" | |
; | ; | ||
[[ISSS608_2017-18_T3_Assign_Vishali_Reddy_Nalla| <font color="#343009"> Introduction </font>]] | [[ISSS608_2017-18_T3_Assign_Vishali_Reddy_Nalla| <font color="#343009"> Introduction </font>]] | ||
| − | | style="font-family:Georgia; font-size:100%; solid #343009; background:#F7E7D4; text-align:center;" width=" | + | | style="font-family:Georgia; font-size:100%; solid #343009; background:#F7E7D4; text-align:center;" width="16%" | |
; | ; | ||
[[ISSS608_2017-18_T3_Assign_VISHALI_REDDY_NALLA - Data Preparation| <font color="#343009"><big><big>Data Preparation</big></big></font>]] | [[ISSS608_2017-18_T3_Assign_VISHALI_REDDY_NALLA - Data Preparation| <font color="#343009"><big><big>Data Preparation</big></big></font>]] | ||
| − | | style="font-family:Georgia; font-size:100%; solid #343009; background:#F7E7D4; text-align:center;" width=" | + | | style="font-family:Georgia; font-size:100%; solid #343009; background:#F7E7D4; text-align:center;" width="16%" | |
| + | ; | ||
| + | [[ISSS608_2017-18_T3_Assign_VISHALI_REDDY_NALLA - Visualisations| <font color="#343009">Visualisations</font>]] | ||
| + | |||
| + | | style="font-family:Georgia; font-size:100%; solid #343009; background:#F7E7D4; text-align:center;" width="16%" | | ||
; | ; | ||
| − | [[ISSS608_2017-18_T3_Assign_VISHALI_REDDY_NALLA - | + | [[ISSS608_2017-18_T3_Assign_VISHALI_REDDY_NALLA - Insights| <font color="#343009">Insights</font>]] |
| − | | style="font-family:Georgia; font-size:100%; solid #343009; background:#F7E7D4; text-align:center;" width=" | + | | style="font-family:Georgia; font-size:100%; solid #343009; background:#F7E7D4; text-align:center;" width="16%" | |
; | ; | ||
| − | [[ISSS608_2017-18_T3_Assign_VISHALI_REDDY_NALLA | + | [[ISSS608_2017-18_T3_Assign_VISHALI_REDDY_NALLA - Conclusion| <font color="#343009"> Conclusion </font>]] |
| style="font-family:Georgia; font-size:100%; solid #343009; background:#F7E7D4; text-align:center;" width="16%" | | | style="font-family:Georgia; font-size:100%; solid #343009; background:#F7E7D4; text-align:center;" width="16%" | | ||
; | ; | ||
| − | [[ | + | [[Assignment_Dropbox_G2| <font color="#343009"> Assignment Dropbox </font>]] |
| | | | ||
| Line 38: | Line 42: | ||
The dataset is downloaded from: [http://www.vacommunity.org/VAST+Challenge+2018 The Visual Analytics Science and Technology (VAST) Challenge] | The dataset is downloaded from: [http://www.vacommunity.org/VAST+Challenge+2018 The Visual Analytics Science and Technology (VAST) Challenge] | ||
| + | |||
<br> | <br> | ||
=2. Data Overview = | =2. Data Overview = | ||
Latest revision as of 23:17, 8 July 2018
|
|
|
|
|
|
|
1. Data Source
The dataset is downloaded from: The Visual Analytics Science and Technology (VAST) Challenge
2. Data Overview
Boonsong Lekagul waterways Readings Data :
The dataset consists of readings of 106 chemicals measured from 1998 – 2016 which are collected from water sensors at 10 locations around the wildlife preserve.
Attributes in this dataset
1) Unique Reading ID
2) Value of the Chemical measure
3) Location where the chemical reading is collected
4) Sample date of chemical reading
5) Measure is the Chemical/Parameter is reading is measured from the water sensor of the waterways
Total number of chemical readings collected over years 1998-2016 are 1,36,825
Chemical Units of Measures Data: This dataset gives the units of all the 106 chemical measures for which readings where taken through water sensors.
Waterways Map in JPG format :
The Map points the locations where the chemical measures are taken and also marks the dumping site
3. Data Preparation
Grouping Chemicals :
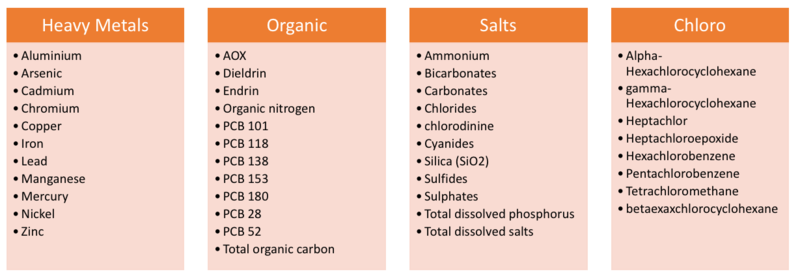
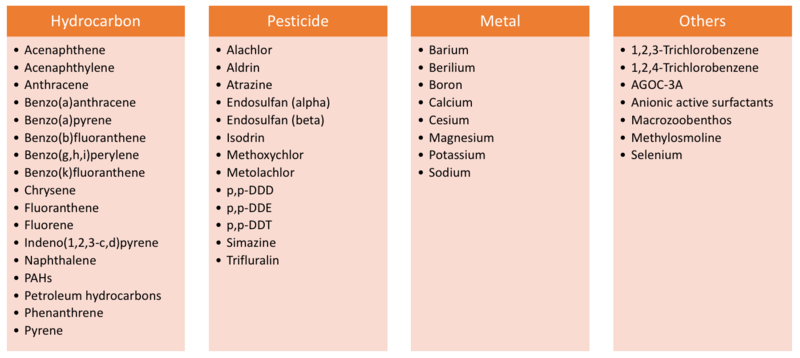
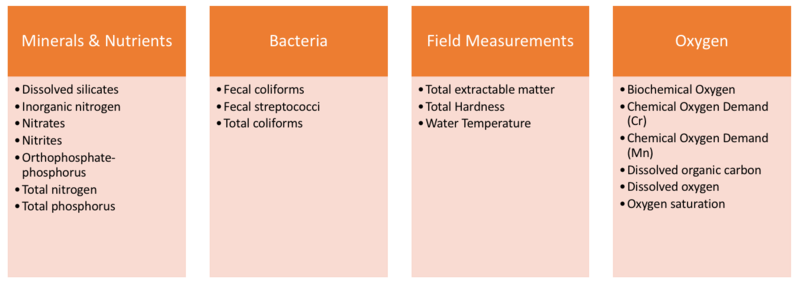
To study the contamination of water based on recordings of 106 chemicals, I have grouped Chemicals together based on their common chemical properties, so as to make visualisations more clear to comprehend. So, I formed 12 chemical groups as below and assigned the chemicals to respective groups in the Chemical units of Measures Data File.
Waterways Map :
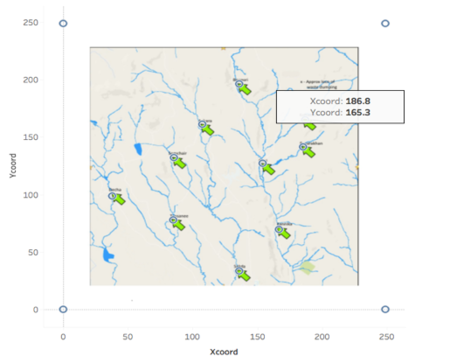
To create visualisations on the waterways image, we need to a source to plot it X and Y Coordinated in Tableau. As the data source files doesn’t have any X & Y coordinates, I have manually created arbitrary X and Y coordinates of the locations with respect to the Waterways Map Image.
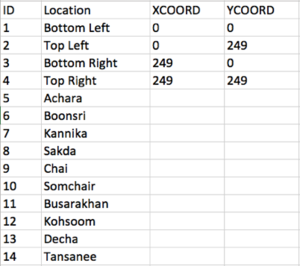
Step 1 – Created a new Excel Sheet with sample boundaries and Location names and assigned coordinates to Boundary Locations which align with Waterways Map picture
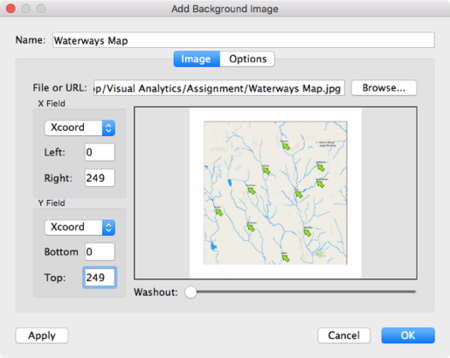
Step 2 – Load the Excel sheet into new Tableau Workbook and insert the XCoord & YCoord to Columns and Rows and turn off the Aggregate measures in Analysis. Then add Background Image as shown below
Step 3 – Now that background image is aligned with the coordinates, to get the arbitrary coordinates of the locations, I have used Annotate to mark each point of the measure and get respective coordinates
Step 4 – Once I got all the coordinates of the locations, I manually filled the XCoord & YCoord fields in the Locations Excel Sheet
Data Joining :
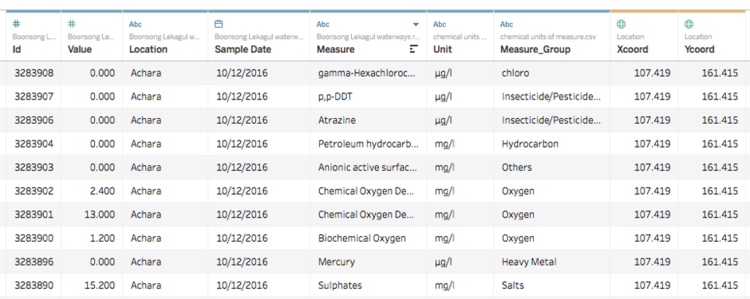
I used Joins in Tableau to join all the three data sheets as below.
Data Source sheet after joining is as shown below -

