Difference between revisions of "MU FUYAO Data Preparation"
(Created page with "<div style="background:#002060; border:#002060; padding-left:15px; text-align:center;"> 150px <font size = 5; color="#FFFFFF"><span style="font-famil...") |
|||
| (2 intermediate revisions by the same user not shown) | |||
| Line 1: | Line 1: | ||
| − | <div style= | + | <div style=background:#2B3856 border:#A3BFB1> |
| − | [[ | + | [[File: MC2 2018.jpg|250px]] |
| − | <font size = 5; color="#FFFFFF"> | + | <font size = 5; color="#FFFFFF">ISSS608 Assignment MU FUYAO - MC2 </font> |
</div> | </div> | ||
| − | <!--MAIN HEADER --> | + | <!--MAIN HEADER --> |
| − | {|style="background-color:# | + | {|style="background-color:#1B338F;" width="100%" cellspacing="0" cellpadding="0" valign="top" border="0" | |
| − | | style="font-family:Century Gothic; font-size:100%; solid #000000; background:# | + | | style="font-family:Century Gothic; font-size:100%; solid #000000; background:#2B3856; text-align:center;" width="25%" | |
| − | ; | + | ; |
| − | [[ | + | [[MU_FUYAO_Overview| <font color="#FFFFFF">Overview</font>]] |
| − | + | ||
| − | | style="font-family:Century Gothic; font-size:100%; solid # | + | | style="font-family:Century Gothic; font-size:100%; solid #000000; background:#2B3856; text-align:center;" width="25%" | |
| − | ; | + | ; |
| − | [[MU_FUYAO_Data Preparation| <font color="#FFFFFF">Data Preparation</font>]] | + | [[MU_FUYAO_Data Preparation| <font color="#FFFFFF">Data Preparation</font>]] |
| − | + | ||
| − | | style="font-family:Century Gothic; font-size:100%; solid #1B338F; background:# | + | | style="font-family:Century Gothic; font-size:100%; solid #1B338F; background:#2B3856; text-align:center;" width="25%" | |
| − | ; [[ | + | ; |
| − | + | [[MU _FUYAO_Analytical Results| <font color="#FFFFFF">Analytical Results </font>]] | |
| − | | style="font-family:Century Gothic; font-size:100%; solid # | + | |
| − | ; | + | | style="font-family:Century Gothic; font-size:100%; solid #000000; background:#2B3856; text-align:center;" width="25%" | |
| − | [[ | + | ; |
| − | + | [[MU_FUYAO_Questions-answer| <font color="#FFFFFF">Questions-answer</font>]] | |
| − | | | + | |
| + | | | ||
|} | |} | ||
| + | <br/> | ||
| + | |||
| + | =Data Preparation= | ||
| + | ==Tools== | ||
| + | |||
| + | '''1.JMP''' | ||
| + | |||
| + | <table> | ||
| + | <table border='1'> | ||
| + | <tr> | ||
| + | <th>Problems</th> | ||
| + | <th>Solutions</th> | ||
| + | </tr> | ||
| + | <tr> | ||
| + | <td><b> 1.Missing value and repetitive value </b> | ||
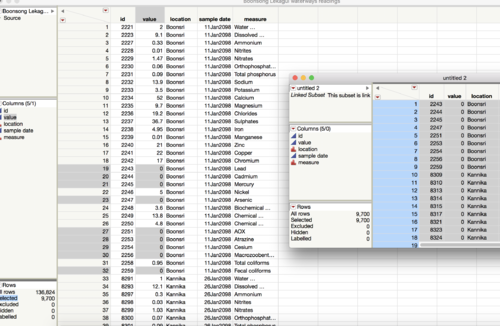
| + | <br>There are some measures having value of 0, I can’t decide whether the measurement is 0 or didn’t have measure. So, I regard it as missing value and delete. | ||
| + | |||
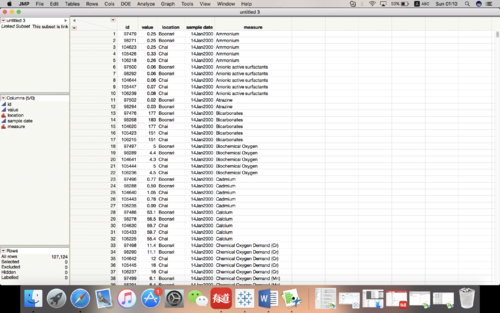
| + | There are some strange values in this dataset. For same location, same time and same measure, but there are different values. I think it’s repetitive value. So, I get average of them. | ||
| + | |||
| + | </td> | ||
| + | <td>[[File: Missing value.png|500px|center]] | ||
| + | |||
| + | [[File:Repetitive data.png|500px|center]]</td> | ||
| + | </tr> | ||
| + | |||
| + | <tr> | ||
| + | <td><b> 2.Wrong format of years</b> | ||
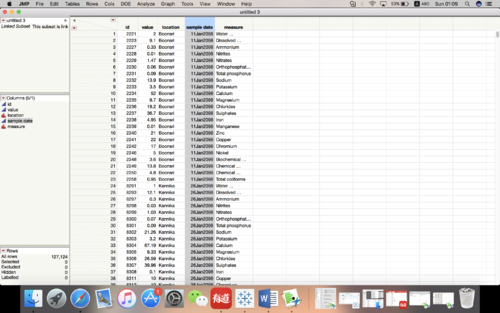
| + | <br>In JMP, it can’t recognize year before 2000. So, for year 1998 and 1999 it will show 2098 and 2099, I have to recode it by myself. | ||
| + | </td> | ||
| + | <td>[[File: Recode year.png|500px|center]]</td> | ||
| + | </tr> | ||
| + | </table> | ||
| + | |||
| + | |||
| + | '''2.Tableau''' | ||
| + | |||
| + | <table> | ||
| + | <table border='1'> | ||
| + | <tr> | ||
| + | <th>Method</th> | ||
| + | <th>Graph</th> | ||
| + | </tr> | ||
| + | <tr> | ||
| + | <td><b> 1.Combine different tables </b> | ||
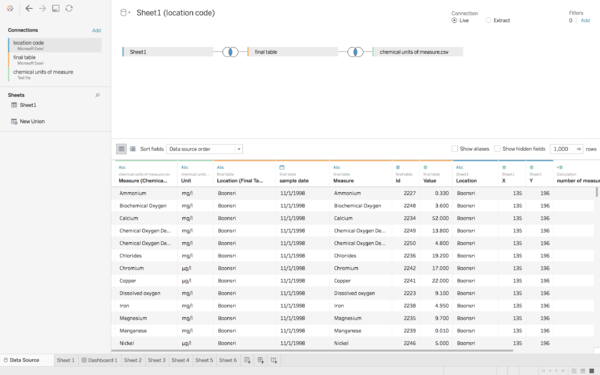
| + | <br>I use three different excel (csv) table in tableau, first I should combine them together then I can use them to draw graph | ||
| + | |||
| + | </td> | ||
| + | <td>[[File: Tableau data.png|600px|center]] | ||
| + | </tr> | ||
| + | |||
| + | <tr> | ||
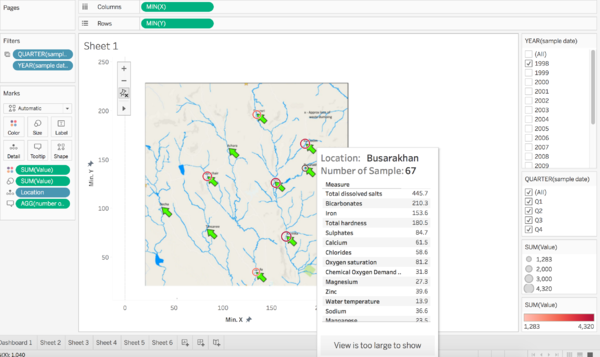
| + | <td><b> 2.Make a map for location</b> | ||
| + | <br>If I want to make sure of location for different cities, I have to do telltale mark. And connect it with other tables. Then I can find exactly location for these 10 cities. | ||
| + | </td> | ||
| + | <td>[[File: Sheet 1.png|600px|center]]</td> | ||
| + | </tr> | ||
| + | </table> | ||
Latest revision as of 20:18, 8 July 2018
|
|
|
|
|
Data Preparation
Tools
1.JMP
| Problems | Solutions |
|---|---|
| 1.Missing value and repetitive value
There are some strange values in this dataset. For same location, same time and same measure, but there are different values. I think it’s repetitive value. So, I get average of them. |
|
| 2.Wrong format of years
|
2.Tableau
| Method | Graph |
|---|---|
| 1.Combine different tables
|
|
| 2.Make a map for location
|

