Difference between revisions of "ISSS608 2017-18 T3 Assign Vishal Badrinarayanan Question2"
Vishalb.2017 (talk | contribs) |
Vishalb.2017 (talk | contribs) |
||
| (4 intermediate revisions by the same user not shown) | |||
| Line 1: | Line 1: | ||
| + | [[File:Breaking-chain1.jpg|centre|700px]] | ||
<!--MAIN HEADER --> | <!--MAIN HEADER --> | ||
<!--MAIN MENU --> | <!--MAIN MENU --> | ||
| Line 4: | Line 5: | ||
| style="font-family: Verdana; font-size:100%; solid #000000; background:#000024; text-align:center;" width="10%"| | | style="font-family: Verdana; font-size:100%; solid #000000; background:#000024; text-align:center;" width="10%"| | ||
; | ; | ||
| − | [[ISSS608_2017- | + | [[ISSS608_2017-18_T3_Assign_Vishal_Badrinarayanan| <font color="#F9C124"><b>Overview</b></font>]] |
| style="font-family:'Droid Sans', sans-serif;; font-size:100%; solid: #FFFF00; background:#000024; text-align:center;" width="10%" | | | style="font-family:'Droid Sans', sans-serif;; font-size:100%; solid: #FFFF00; background:#000024; text-align:center;" width="10%" | | ||
| Line 21: | Line 22: | ||
; | ; | ||
[[ISSS608_2017-18_T3_Assign_Vishal_Badrinarayanan_Question3| <font color="#F9C124"><b>Question 3</b></font>]] | [[ISSS608_2017-18_T3_Assign_Vishal_Badrinarayanan_Question3| <font color="#F9C124"><b>Question 3</b></font>]] | ||
| + | |||
| + | | style="font-family:'Droid Sans', sans-serif;; font-size:100%; solid :#FFFF00; background:#000024; text-align:center;" width="10%" | | ||
| + | ; | ||
| + | [[ISSS608_2017-18_T3_Assign_Vishal_Badrinarayanan_Question4| <font color="#F9C124"><b>Question 4</b></font>]] | ||
| style="font-family:'Droid Sans', sans-serif;; font-size:100%; solid :#FFFF00; background:#000024; text-align:center;" width="10%" | | | style="font-family:'Droid Sans', sans-serif;; font-size:100%; solid :#FFFF00; background:#000024; text-align:center;" width="10%" | | ||
| Line 30: | Line 35: | ||
[[Assignment_Dropbox_G2| <font color="#F9C124"><b>BACK TO HOME</b></font>]] | [[Assignment_Dropbox_G2| <font color="#F9C124"><b>BACK TO HOME</b></font>]] | ||
| − | |} | + | |} |
<!--QUESTION 2--> | <!--QUESTION 2--> | ||
| + | <p><font color="#F9C124"><b><h2>Observation and Analysis</h2></b></font></p> | ||
| + | <br> | ||
<p>For the network graph we have chosen both static and dynamic plots.</p> | <p>For the network graph we have chosen both static and dynamic plots.</p> | ||
<p>The static plot was made with the following configurations:</p> | <p>The static plot was made with the following configurations:</p> | ||
| Line 44: | Line 51: | ||
<p> | <p> | ||
| − | STATIC PLOT <br> | + | <strong><h3>STATIC PLOT </h3></strong><br> |
| − | WITHOUT FILTERS | + | <strong>WITHOUT FILTERS</strong> |
[[File:Vishal Static graph without filter.JPG|600px|center]] | [[File:Vishal Static graph without filter.JPG|600px|center]] | ||
<br> | <br> | ||
| − | WITH FILTERS - This can help filtering down the graph for analysis. | + | <strong>WITH FILTERS</strong> - This can help filtering down the graph for analysis. |
<br> | <br> | ||
[[File:Vishal Static network.jpg|600px|center]] | [[File:Vishal Static network.jpg|600px|center]] | ||
</p> | </p> | ||
| − | <p>Betweenness Centrality : It is calculated based on the shortest path between nodes. It is based on the fact that the node will exist in the shortest path between many different nodes and thus becomes important in a network.</p> | + | <p><strong>Betweenness Centrality</strong> : It is calculated based on the shortest path between nodes. It is based on the fact that the node will exist in the shortest path between many different nodes and thus becomes important in a network.</p> |
| − | <p>Eigen Vector Centrality : <strong> </strong>It is a measure to identify the amount of influence a node has on its network. It is based on the theory that high scoring nodes contribute more to score of a node than equal low scoring ones. High scoring is the one that is connected to many nodes who has high score themselves.</p> | + | <p><strong>Eigen Vector Centrality </strong>: <strong> </strong>It is a measure to identify the amount of influence a node has on its network. It is based on the theory that high scoring nodes contribute more to score of a node than equal low scoring ones. High scoring is the one that is connected to many nodes who has high score themselves.</p> |
<p> </p> | <p> </p> | ||
<p>In this graph all the nodes which are green colored are in the suspicious list provided by the insider. So we need to analyze the networks of the pink nodes which are present and determine whether they can be suspicious or not.</p> | <p>In this graph all the nodes which are green colored are in the suspicious list provided by the insider. So we need to analyze the networks of the pink nodes which are present and determine whether they can be suspicious or not.</p> | ||
| − | |||
<p>According to the graph the highest betweenness centrality is for the node representing the person Richard Fox. When we analyze only the node of Richard Fox we find that he is connected to most of the other nodes with high betweenness centrality and who are in the suspicious list which implies that Richard Fox is someone important for the organization who is connected to many which is why he is one of the main candidates in the suspicious people.</p> | <p>According to the graph the highest betweenness centrality is for the node representing the person Richard Fox. When we analyze only the node of Richard Fox we find that he is connected to most of the other nodes with high betweenness centrality and who are in the suspicious list which implies that Richard Fox is someone important for the organization who is connected to many which is why he is one of the main candidates in the suspicious people.</p> | ||
| Line 138: | Line 144: | ||
<p>In the above static graph the purchases are represented by Blue edges. From the graph we are able to conclude that in most of the purchases the target node in Gail Feindt and the source is 857138(Richard Fox) , 1690582 (meryl Pastuch) , 969089(Tobi Gaitlin) ,623027(Lizbeth Jindra).</p> | <p>In the above static graph the purchases are represented by Blue edges. From the graph we are able to conclude that in most of the purchases the target node in Gail Feindt and the source is 857138(Richard Fox) , 1690582 (meryl Pastuch) , 969089(Tobi Gaitlin) ,623027(Lizbeth Jindra).</p> | ||
<p> | <p> | ||
| − | [[File: | + | [[File:Vishal2 Suspicious wrt time of day.jpg|300px|center]] |
| + | [[File:Vishal Purchase gephi.jpg|600px|center]] | ||
</p> | </p> | ||
<p>From the above two pictures we find that there is an unusual amount between Richard fox and Gail Feindt. Also from the bar graph we find that there are lot of purchases happening at odd timing which make the purchase suspicious.</p> | <p>From the above two pictures we find that there is an unusual amount between Richard fox and Gail Feindt. Also from the bar graph we find that there are lot of purchases happening at odd timing which make the purchase suspicious.</p> | ||
Latest revision as of 03:22, 10 July 2018
|
|
|
|
|
|
|
|
|
Observation and Analysis
For the network graph we have chosen both static and dynamic plots.
The static plot was made with the following configurations:
- Degree Range Settings – 3 – 1121
- Node color – Suspicious List
- Node Size – Betweenness Centrality
- Node Label Size – Eigen Vector Centrality.
STATIC PLOT
WITHOUT FILTERS
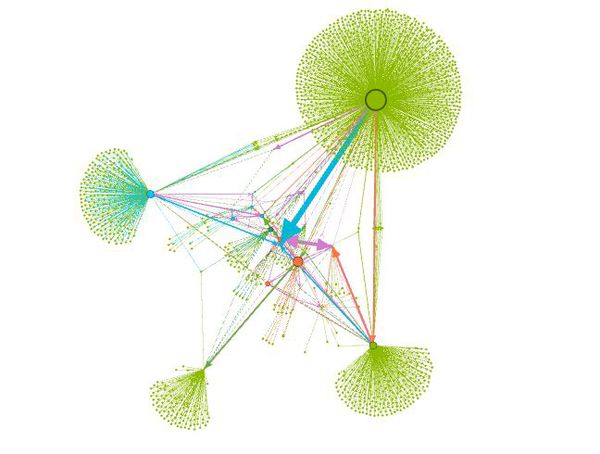
WITH FILTERS - This can help filtering down the graph for analysis.
Betweenness Centrality : It is calculated based on the shortest path between nodes. It is based on the fact that the node will exist in the shortest path between many different nodes and thus becomes important in a network.
Eigen Vector Centrality : It is a measure to identify the amount of influence a node has on its network. It is based on the theory that high scoring nodes contribute more to score of a node than equal low scoring ones. High scoring is the one that is connected to many nodes who has high score themselves.
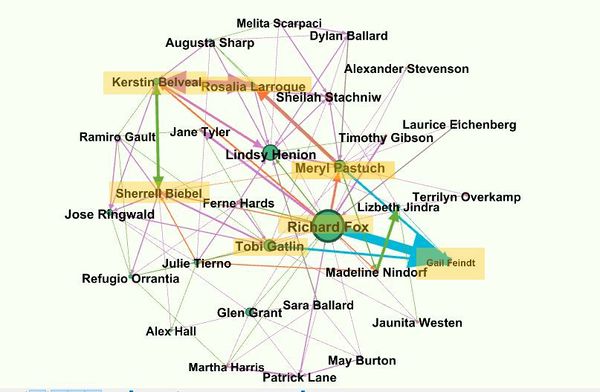
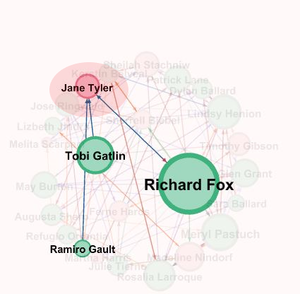
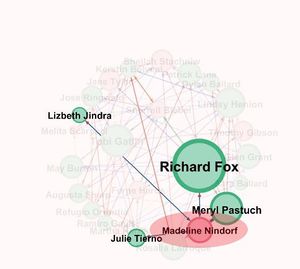
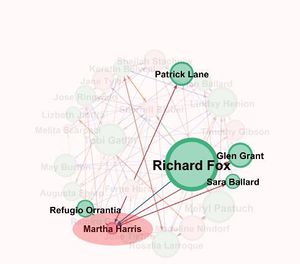
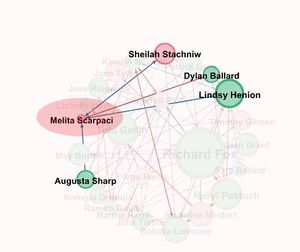
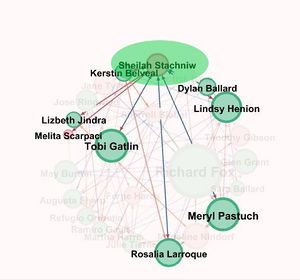
In this graph all the nodes which are green colored are in the suspicious list provided by the insider. So we need to analyze the networks of the pink nodes which are present and determine whether they can be suspicious or not.
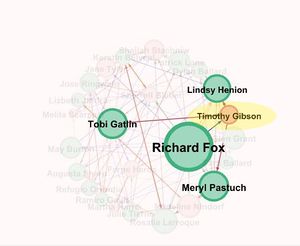
According to the graph the highest betweenness centrality is for the node representing the person Richard Fox. When we analyze only the node of Richard Fox we find that he is connected to most of the other nodes with high betweenness centrality and who are in the suspicious list which implies that Richard Fox is someone important for the organization who is connected to many which is why he is one of the main candidates in the suspicious people.
Now let us look at another Suspicious person Lindsey whose name was provided by the insider . From the network we find that she is connected to Richard Fox and some other suspicious nodes(green color) whose centrality is high which is represented by its size which makes her also suspiciousAlso from the network we find that she is also connected to many pink nodes which are not a part of the suspicious list provided.
So from this we can tell that there is a high possibility of a node being suspicious depending on the nodes which he is connected to. If they are connected to many suspicious and if some have high centrality value then there is a high possibility of being involved with the suspicious nodes.
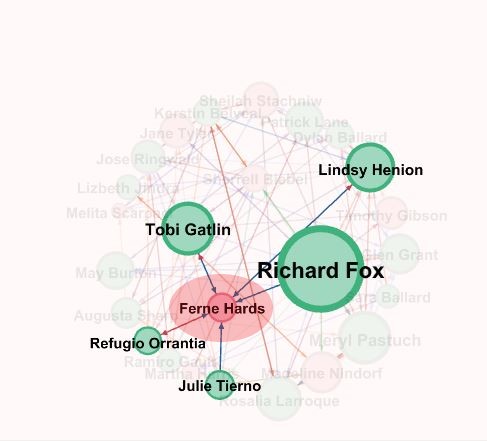
Let us look the Node Ferne Hards . From the graph we find that it is connected to the node Richard Fox , Tobi Gatlin , Lindsey Henion, Refugio orrantia and Julie Tierno. Since it is associated to most of the highly ranked suspicious node there is a high possibility of this node being suspicious .
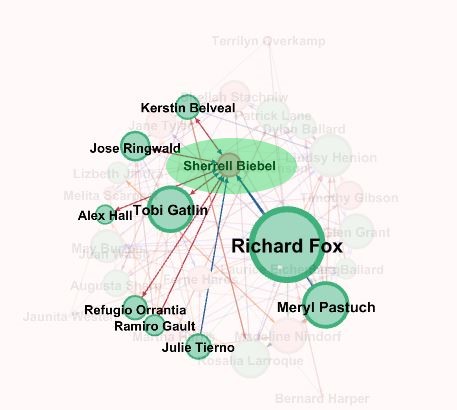
Let us take another example of the node Sherrell Biebel. From the network graph highlighting Sherrel Biebel and all of its connected nodes we find that it is connected to nodes like Richrd Fox , Merly Pastuch ,Tobi Gaitlin etc which are in the suspicious list and have high betweenness centrality which tells that it is closely associated.
From the images we can provide additional set of people who have a high probability of being suspicious. They are:
- Ferne Hards
- Sherrell Biebel
- Sheila Stachniw
- Jane Tyler
- Timothy Gibson
- Melita Scarpaci
- Madeline Nindorf
- Martha Harris
Now for the second part to find the suspicious purchases we look at the static graph since they are very less in count and in the dynamic graph we filter the nodes based on degree which remove the purchase node from the graph. But in a static network graph it gives a more accurate picture as the edge weights are represented which gives the thickness to the edges unlike dynamic which eliminates the grouping of the nodes.
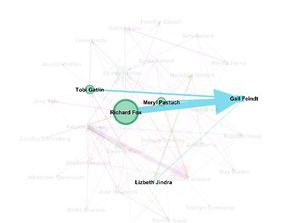
In the above static graph the purchases are represented by Blue edges. From the graph we are able to conclude that in most of the purchases the target node in Gail Feindt and the source is 857138(Richard Fox) , 1690582 (meryl Pastuch) , 969089(Tobi Gaitlin) ,623027(Lizbeth Jindra).
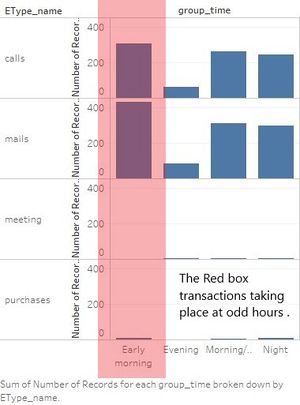
From the above two pictures we find that there is an unusual amount between Richard fox and Gail Feindt. Also from the bar graph we find that there are lot of purchases happening at odd timing which make the purchase suspicious.

